

Developer marketing analytics is all about tracking what really matters: technical engagement, not traditional metrics. Developers don't follow linear buying journeys like most B2B audiences. Instead, they dive into documentation, test APIs, or explore GitHub. This means your analytics stack needs to focus on metrics like documentation depth, API usage, and GitHub activity to understand developer behavior.
Key Takeaways:
- Awareness Metrics: Track branded search volume, problem-oriented searches, GitHub views, and share of voice on platforms like Reddit or Stack Overflow.
- Engagement Metrics: Focus on actions like copying code snippets, deep documentation exploration, and time to first success (TTFS).
- Conversion Metrics: Measure qualified signups, trial-to-paid rates, and project-level adoption to tie engagement to revenue.
- Tools to Use: Combine web analytics (e.g., Plausible), product analytics (e.g., PostHog or Amplitude), and CRM/attribution tools (e.g., HubSpot, Dreamdata) for a full-funnel view.
Reporting Cadence:
- Weekly: Monitor quick fixes like GitHub traffic, onboarding errors, and code snippet copies.
- Monthly: Analyze broader trends like SEO rankings, documentation usage, and retention rates.
- Quarterly: Evaluate long-term metrics like CAC, NDR, and pipeline influence.
To effectively track "dark funnel" activities - like private Slack discussions or word-of-mouth - use proxy metrics like GitHub stars, community mentions, and open-text survey responses. A tailored analytics stack and thoughtful reporting help you connect technical engagement to business outcomes.
Core Metrics for Developer Marketing
Developers don’t follow a straight path when evaluating tools. They might first notice a tool, then dive into its documentation or code. Because of this, your metrics need to reflect this fluid journey rather than sticking to traditional B2B sales frameworks.
Awareness Metrics
Awareness metrics measure whether developers know about your tool when they need it. Branded search volume is a key indicator - if people are searching for your product by name, that’s a sign you’re on their radar. On the flip side, problem-oriented searches like “how to authenticate API requests” show if your tool is discoverable when developers are tackling specific technical problems. Tracking 10–20 of these problem-based terms can help you evaluate your visibility during those critical moments.
Another useful metric is share of voice, which looks at your presence in technical conversations compared to competitors. This includes your rankings for key industry terms and mentions in developer hubs like Reddit, Discord, and Stack Overflow. Don’t overlook GitHub repository views either - developers often stumble upon tools while browsing code. By checking referrer traffic in GitHub Insights, you can see exactly where these discoveries are happening.
"Distinguish between awareness metrics and business metrics. Awareness metrics help you understand reach and brand recognition. Business metrics predict revenue and growth. Both matter, but never confuse one for the other." - GrowthPigeon
Early engagement with documentation - such as copying code samples or cloning starter repositories - also signals growing interest from developers.
Once awareness is established, the focus shifts to tracking how engaged developers are with your tool.
Engagement Metrics
After developers become aware of your tool, engagement metrics show how seriously they’re considering it. One of the strongest signals is in-depth documentation engagement. Developers who go beyond the basic setup are four times more likely to convert. Tools like PostHog or Plausible can track how far users navigate into your docs using docs_page_path_depth.
Code interaction is another critical signal. Actions like copying code snippets, cloning starter repos, or forking your GitHub repository indicate developers are preparing to test your tool in their own environment. Track these actions, especially copy-button clicks on code samples, to gauge intent. Additionally, sandbox usage and error rates during onboarding can uncover where friction is causing drop-offs before developers reach your tool’s full value.
A key metric here is Time to First Success (TTFS) - how long it takes developers to achieve a working result. TTFS benchmarks vary by tool type: Auth/API libraries (5–15 minutes), Frameworks/SDKs (15–45 minutes), and Infrastructure tools (45–90 minutes). Reviewing internal documentation search logs can also reveal the challenges developers associate with your tool, offering insight into their problem-solving process.
Conversion and Revenue Metrics
Once you’ve measured awareness and engagement, conversion metrics show how developer interest translates into business outcomes. Qualified signups are a critical indicator - these should meet specific criteria like fitting your ideal customer profile (ICP) or completing a key product action. Look for technical milestones like “API key created” or “first successful request” as signs of serious intent.
Product activation, or the moment when developers experience the tool’s value, often involves events like completing a “getting started” tutorial, making their first successful API call, or integrating the tool into a production system. Another important measure is your trial-to-paid conversion rate, which tracks how many evaluating developers upgrade to a paid tier. While marketing may focus on promoting features and driving adoption, the final conversion might not always fall under their direct control.
For broader business insights, monitor pipeline influence, which combines expected deal size with the number of qualified accounts. To gauge efficiency, track customer acquisition cost (CAC) across your funnel. Finally, for long-term success, measure project-level adoption - whether your tool appears in dependency files, lockfiles, or CI/CD workflows. This shows your tool’s value extends beyond initial testing.
| Funnel Stage | Critical Metric | What It Reveals |
|---|---|---|
| Activation | Time to First Success | Speed to working outcome (5–90 min depending on tool type) |
| Activation | API Key Creation | Developer moving from reading to running code |
| Conversion | Qualified Signups | Signups meeting ICP or product-usage criteria |
| Revenue | Trial-to-Paid Rate | Percentage of evaluators becoming paying customers |
| Growth | Expansion Revenue | Revenue from existing accounts adopting more features |
| Retention | Project-Level Adoption | Tool present in active project dependency manifests |
To capture insights from sources that are hard to track, like Slack communities or word-of-mouth, include a free-text “How did you hear about us?” field on high-intent forms.
sbb-itb-e54ba74
Building Your Developer Marketing Analytics Stack
::: @figure 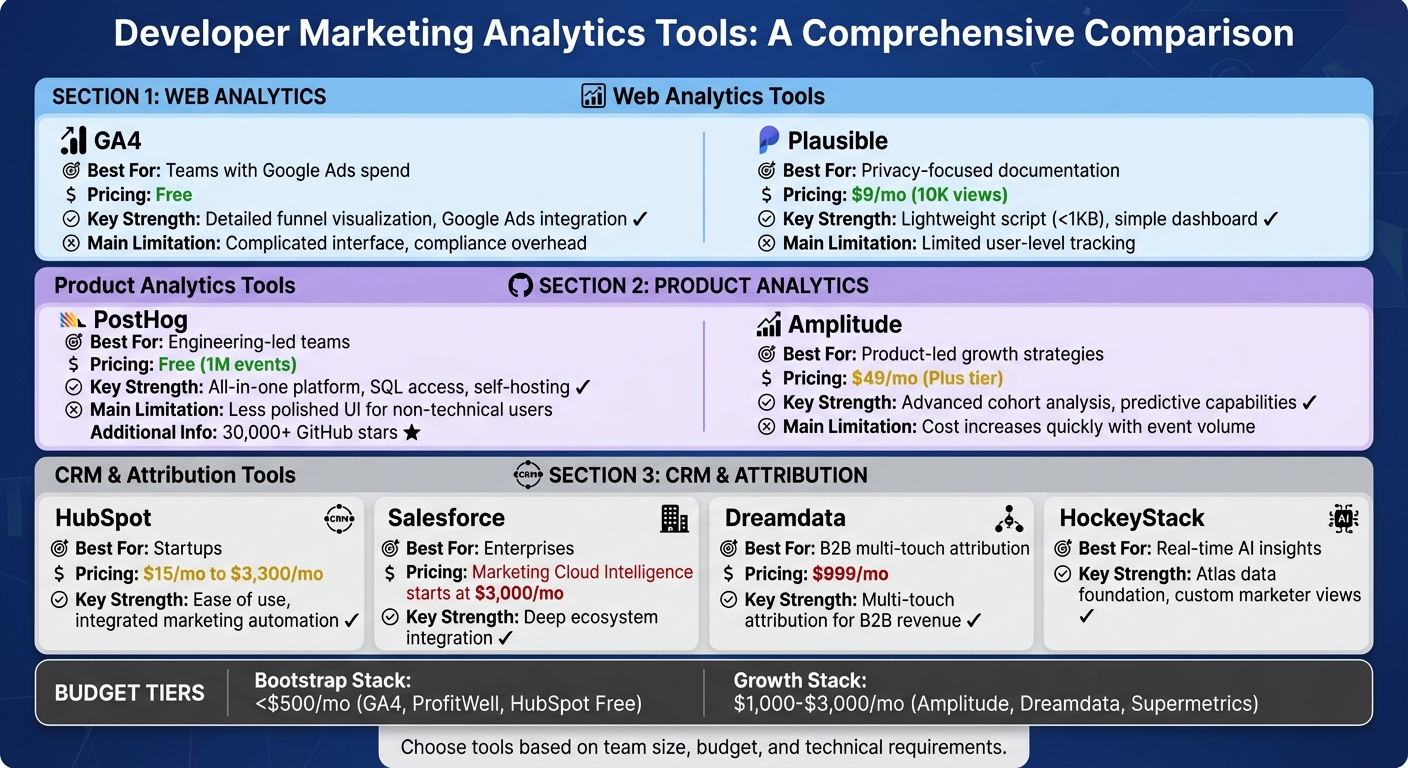 {Developer Marketing Analytics Tools Comparison: Features, Pricing, and Best Use Cases}
Once you've identified the key metrics for developer marketing, the next step is to pull them into a streamlined analytics stack. This stack combines web analytics for discovery, product analytics for usage, and CRM tools with attribution capabilities to connect engagement to revenue. Each layer provides insights into different stages of the developer journey - from the first visit to your documentation to consistent API usage in production. Here's how it works:
- Web analytics pinpoint which content draws developers to your site.
- Product analytics reveal whether those developers find value in your tools.
- Attribution tools identify which marketing channels bring in the most high-value technical users.
For example, in 2025, TestGorilla collaborated with SaaSHero to build an attribution-focused analytics stack. By linking ad spend to CRM outcomes, they achieved an impressive 80-day payback period . Similarly, TripMaster eliminated data silos through a unified data integration approach, unlocking $504,758 in Net New ARR over one year by identifying previously untracked acquisition channels. These examples highlight how an integrated analytics stack can directly impact developer marketing success .
If you're working with a smaller budget, consider starting with a Bootstrap Stack (using GA4, ProfitWell, and HubSpot Free), which costs under $500 per month. As your revenue grows to $1,000–$3,000 per month, you can upgrade to a Growth Stack with tools like Amplitude, Dreamdata, and Supermetrics . The secret isn't just in the tools themselves but in how well they work together.
Web Analytics: GA4 and Plausible
Web analytics tools help track how developers discover your product, whether through documentation, blog content, or marketing campaigns. While GA4 is the industry standard with robust Google Ads integration and detailed funnel visualization, it has its challenges - its interface is complex, and compliance requirements for GDPR/CCPA can be burdensome .
On the other hand, Plausible offers a privacy-first, lightweight alternative that developers often prefer. It uses a script smaller than 1KB, doesn't require cookie banners, and features a simple one-page dashboard for tracking traffic sources, top-performing pages, and UTM parameters.
"The only genuinely wrong choice is Google Analytics 4. Do not use GA4 in 2026. The compliance overhead alone is not worth it for a solo project, and the UX is genuinely bad."
– DevToolPicks
GA4 is ideal for teams already invested in the Google ecosystem or those needing advanced ad integration. It’s free for standard use and offers unlimited data retention, though its steep learning curve and less intuitive reporting can be a hurdle. Meanwhile, Plausible, starting at $9 per month for 10,000 pageviews, excels at tracking documentation engagement and referral sources, though it lacks granular user-level tracking.
| Tool | Best For | Pricing | Key Strength | Main Limitation |
|---|---|---|---|---|
| GA4 | Teams with Google Ads spend | Free | Detailed funnel visualization, Google Ads integration | Complicated interface, compliance overhead |
| Plausible | Privacy-focused documentation | $9/mo (10K views) | Lightweight script, simple dashboard | Limited user-level tracking |
Product Analytics: Amplitude and PostHog
Once developers sign up, product analytics tools help track their activity - like API key creation, first successful requests, and recurring usage. These tools treat interactions as events, making it easier to follow the journey from your marketing site to your product.
PostHog is an open-source platform offering analytics, session replay, and feature flags. It’s free for up to 1 million events per month, making it a great option for early-stage tools. With over 30,000 GitHub stars, PostHog also provides SQL access to raw data and self-hosting options.
Amplitude stands out for its advanced behavioral cohort analysis and predictive capabilities, making it a favorite for product-led growth teams. It’s excellent for tracking complex funnels and retention metrics, and its polished interface makes it accessible to non-technical stakeholders. Amplitude Plus starts at $49 per month, with a free tier offering up to 1 million events monthly.
The choice between these tools depends on your team’s needs. PostHog is perfect for engineering-led teams that prioritize data ownership and customization, while Amplitude suits cross-functional teams needing intuitive, self-service reporting without SQL expertise.
"Most web analytics tools were built for marketers – not developers – which makes finding one that actually fits a modern dev workflow harder than it should be."
– Natalia Amorim, PostHog
Both tools can track key developer milestones, such as first successful API calls or CLI installations. To get the most out of these tools, focus on tracking high-intent actions, like clicks on "copy code" buttons or deep dives into documentation.
| Tool | Best For | Pricing | Key Strength | Main Limitation |
|---|---|---|---|---|
| PostHog | Engineering-led teams | Free (1M events) | All-in-one platform, SQL access, self-hosting | Less polished UI for non-technical users |
| Amplitude | Product-led growth strategies | $49/mo (Plus tier) | Advanced cohort analysis, predictive capabilities | Cost increases quickly with event volume |
CRM and Attribution Tools
CRM and attribution tools are essential for connecting technical engagement - like CLI downloads or documentation usage - to revenue outcomes. Popular CRM platforms include HubSpot and Salesforce, while attribution tools like Dreamdata and HockeyStack specialize in tracking multi-touch journeys for B2B developer tools.
HubSpot is a go-to for startups due to its ease of use and integrated marketing automation. Plans start at $15 per month and scale up to $3,300 per month for enterprise features. Salesforce, on the other hand, is better suited for enterprises, offering deeper ecosystem integration but requiring more setup and training. Its Marketing Cloud Intelligence starts at $3,000 per month.
Attribution tools like Dreamdata ($999/month) and HockeyStack are designed to bridge the gap between anonymous web activity and identified CRM contacts. Dreamdata focuses on multi-touch attribution for B2B revenue, while HockeyStack’s "Atlas" data foundation enables real-time AI insights and allows marketers to build custom views independently.
"With HockeyStack, we finally have the flexibility and visibility we lacked for years. Each marketer can create the views they need - without depending on BI or waiting weeks for answers."
– Lucía Delpozo, Head of Market Intelligence, Kantox
These tools are particularly useful for tracking the lengthy evaluation cycles typical of developer buyers. Look for platforms that support U-shaped or W-shaped attribution models, as these better capture the research-intensive buying process. Integrating product analytics with CRM tools ensures you can connect early engagement - like API testing or documentation use - to eventual revenue, completing your analytics stack from discovery to long-term success.
Designing Dashboards for Developer Marketing
A solid analytics stack should deliver data that drives action. To achieve this, it's essential to create separate dashboards: one for leadership to focus on high-level business outcomes, and another for marketing teams to dig into detailed funnel metrics. Trying to cram both into one dashboard risks overwhelming executives while leaving marketers without the insights they need.
The trick is to distinguish lagging metrics (what’s already happened) from leading metrics (early indicators of future performance).
"You treat it as a product and measure ROI at a program level. You optimize activities within the programs but don't report ROI on them"
In practice, leadership dashboards should highlight metrics like qualified signups, self-serve revenue, and pipeline value. Meanwhile, optimization dashboards should track details like documentation engagement, API success rates, and onboarding error rates. This approach ensures alignment between business objectives and technical engagement metrics.
Dashboards for Leadership
When designing dashboards for leadership, focus on metrics that showcase revenue impact. Executives want clarity on whether marketing investments are driving qualified accounts and how efficiently customers are being acquired. Metrics to include are:
- Qualified signups: Based on specific product actions or ideal customer profile (ICP) matches.
- Self-serve revenue: Revenue directly generated without sales team involvement.
- Pipeline value: Calculated as expected deal size multiplied by qualified accounts.
- Customer lifetime value (CLV): Long-term revenue potential of acquired customers.
Keep it simple - stick to five to seven key metrics, use dollar figures where applicable, and highlight trends over time (monthly or quarterly). Data sources like HubSpot, Salesforce, and Stripe can provide the necessary insights. Regular updates ensure the dashboard stays relevant and actionable.
Dashboards for Optimization
For marketing teams, the focus shifts to technical engagement and funnel health. This dashboard should track leading indicators that signal whether developers are likely to convert. Key metrics include:
- Documentation depth: A reflection of how engaged users are with your resources.
- API success rates: Success during onboarding can predict long-term usage.
- Code snippet copies: Indicates developer interest in implementing your tools.
- Tutorial completion rates: Tracks how effectively users are guided through initial steps.
Documentation engagement often serves as a strong predictor of conversion intent. Monitoring onboarding error rates can help identify and address friction points early, ensuring users experience your product’s value faster. Tools like PostHog and Amplitude are excellent for tracking these signals, with weekly reviews to catch issues before they escalate.
For privacy-conscious tracking, consider tools like Plausible or server-side analytics. You can also use proxy metrics like npm downloads or Docker pulls to gauge engagement.
Sample Metrics Framework
Here’s how to structure your metrics by dashboard type:
| Metric Category | Dashboard Type | Key KPIs | Recommended Tools |
|---|---|---|---|
| Business Impact | Leadership | Qualified Signups, Self-serve Revenue, Pipeline Value, CLV | HubSpot, Salesforce, Stripe |
| Technical Engagement | Optimization | Doc Depth, API Success Rate, Code Snippet Copies, Tutorial Completion | PostHog, Amplitude, Segment |
| Awareness & Reach | Optimization | Branded Search Volume, Share of Voice, GitHub Stars/Forks | Google Search Console, Orbit, Common Room |
| Content Performance | Optimization | Time on Page (Docs), Scroll Depth, Inbound Links, 90-day View Growth | Plausible, GA4, Search Console |
This framework ties together awareness, engagement, and revenue, providing a comprehensive view of your marketing efforts.
When setting up dashboards, collaborate with sales and product teams to define a "qualified signup." This could mean completing a specific product action (like creating an API key) or meeting ICP criteria (e.g., company size or industry). This ensures marketing efforts focus on high-intent users instead of chasing vanity metrics.
"Impressions are the worst vanity metric you can think of. Someone scrolling past your social media post without properly noticing it still counts as an impression"
Finally, track content performance over 30-, 60-, and 90-day intervals. This helps identify which technical topics provide lasting value versus those that generate short-term spikes. By focusing on evergreen content, you can drive sustained growth and avoid wasting resources on fleeting trends.
Tracking the Dark Funnel in Developer Marketing
What Is the Dark Funnel?
The dark funnel refers to all those untraceable interactions that developers have while exploring tools and solutions. These are the moments that happen outside the reach of typical tracking systems - like private Slack chats, Discord servers, direct messages, internal wikis, and word-of-mouth discussions. Unlike clicks and conversions that are easy to track, these touchpoints stay hidden.
"The 'dark social' problem affects developer attribution more severely than traditional B2B marketing because technical professionals extensively share tools and resources through private channels." - Jono Bacon, Founder, Stateshift
Developers are also known for blocking trackers, making 30% to 70% of their engagement invisible . For example, a developer might hear about your product in a private Slack conversation or a podcast, but by the time they visit your site, the original source is impossible to trace.
This has a huge impact: 52% of developer tool discovery happens through unmeasurable word-of-mouth channels, compared to just 23% for general business software . Traditional marketing tools, which rely on tracking email clicks or form submissions, fall short here. Developers lean toward documentation, GitHub, and community discussions - places where tracking systems can’t operate. This is where alternative signals become essential for understanding these hidden interactions.
Using Proxy Metrics to Estimate Dark Funnel Activity
Since the dark funnel can’t be tracked directly, you’ll need to rely on proxy metrics to get a sense of what’s happening behind the scenes. Here’s how you can start piecing together the puzzle:
Ask directly: Add an open-text field like "How did you hear about us?" to your forms. This can uncover sources like "Python Discord" or "a colleague recommended it." For developer tools, these surveys often see high completion rates - up to 78% .
Track community activity: Metrics like GitHub stars, forks, and clones can hint at how many developers are experimenting with your tool. Similarly, growth in Discord members or mentions on Stack Overflow can reveal interest sparked in private or community-driven spaces. A sudden spike in these numbers without a corresponding rise in trackable traffic is a strong indicator of dark funnel activity.
Monitor documentation usage: Developers who dive deep into your documentation - beyond basic setup guides and into specific API references - are 4x more likely to convert . Use server-side analytics to track actions like "copy code" clicks or scroll depth. These behaviors often stem from recommendations you’ll never see in attribution reports.
Look for team-level patterns: When multiple users from the same organization sign up or invite teammates, it’s a sign of internal advocacy. Someone likely shared your tool in a private Slack channel or team meeting. While invisible to traditional tracking, these conversions are often some of the most valuable.
Setting Up a Reporting Cadence
Dashboards might provide insights, but without a structured reporting cadence, those insights can get lost in the shuffle. A consistent schedule ensures your team stays on the same page, with reporting frequency tailored to how quickly metrics change. Weekly reports focus on immediate, actionable signals, while quarterly reviews look at the bigger picture, tracking business impacts that take time to unfold.
"If you can't draw a line from your work to business outcomes, you don't have a function - you have a hobby." - Jono Bacon, Founder, Built for Devs
It’s also critical that marketing, sales, and product teams agree on shared definitions for terms like "First Success" and PQLs (Product-Qualified Leads) to avoid wasting time on vanity metrics. For developer tools, PQLs typically convert at rates between 15% and 30%, far outpacing the 2% to 5% conversion rates of traditional MQLs (Marketing-Qualified Leads) .
Weekly Reporting
Weekly reports are all about catching and resolving technical issues early. Metrics to watch include GitHub repository views, how deeply users scroll through documentation, code sample copy events, and onboarding error rates .
Take Yodel Mobile as an example. In 2025, they automated their weekly reporting using Improvado and BigQuery. Data Analyst Kasia Pasich spearheaded the project, cutting report prep time by 80%. This freed up the team to focus on optimization rather than data wrangling. They combined data from multiple sources into Looker Studio, creating a single view of engagement metrics .
Another key area to monitor is community activity. For instance, a sudden spike in GitHub clones without a corresponding increase in tracked traffic could signal "dark funnel" activity - developers sharing your tool in private channels like Discord or Slack. Setting up automated alerts for significant changes, such as a drop in API success rates, can help you address potential conversion issues before they show up in your monthly reports .
These weekly insights lay the groundwork for the more detailed trend analysis that happens in monthly reviews.
Monthly Reporting
Monthly reviews take a step back to look at broader trends. Key metrics include search engine rankings for problem-focused keywords (not just your brand name), Stack Overflow question views, and Monthly Active Developers (MAD). For MAD, this means tracking users who perform authenticated actions like API calls or code commits within a 30-day window .
This is also the time to dig into cohort retention and activation rates. For developer tools, activation rates between 20% and 40% are considered healthy . Cross-reference these metrics with your content calendar to see which guides or tutorials are driving sustained engagement. Since developer content often takes time to gain traction, it’s useful to track performance over 30-, 60-, and 90-day intervals to identify which resources have lasting impact .
In 2025, ASUS implemented an automated data pipeline that saved their team 90 hours per week by standardizing global marketing reports. According to Jeff Lee, Head of Community and Digital Strategy, this system eliminated the need for manual data normalization, allowing the team to focus on analysis rather than collection .
Quarterly Reporting
Quarterly reviews are where you assess the long-term impact of your efforts. Metrics like revenue influence, Customer Acquisition Cost (CAC), Net Dollar Retention (NDR), and the LTV:CAC ratio take center stage. For developer-focused companies, an LTV:CAC ratio between 3:1 and 8:1 and an NDR in the range of 110% to 130% are strong indicators of success .
This is also the time to evaluate whether developers are transitioning from trial users to fully integrated customers. Metrics like recurring API calls and CI/CD pipeline integrations can show whether your tool has become essential to their workflow, reflecting the longer evaluation cycles typical of developer tools .
A great example comes from SoftwareOne, which conducted a cost-benefit analysis in 2025 comparing custom-built and off-the-shelf data platforms. Their Improvado implementation delivered a 3X ROI by eliminating the need for developers to maintain custom API connectors, significantly reducing delays . Quarterly reviews are the perfect time for this type of ROI analysis, as they integrate insights from both weekly and monthly reports to guide strategic decisions.
| Cadence | Focus Metrics | Primary Goal |
|---|---|---|
| Weekly | GitHub traffic, documentation depth, code copies, community mentions | Quick adjustments |
| Monthly | SEO rankings, MAD, Stack Overflow views, cohort retention | Spotting trends in funnel movement and community health |
| Quarterly | Revenue influence, CAC, NDR, ICP validation | Evaluating long-term campaign performance and strategic alignment |
Conclusion
Developer marketing requires a unique approach to analytics because developers don’t follow the typical linear paths seen in other audiences. Instead, their journey often starts with documentation, moves through API exploration, and hinges on technical merit rather than flashy marketing materials.
"Developers typically start with documentation or code examples. They make decisions based on technical merit, not marketing copy. Traditional funnels miss these behaviors entirely." - GrowthPigeon
To capture these behaviors effectively, the right analytics tools are key. Privacy-focused platforms like Plausible or self-hosted solutions like PostHog address the challenge of tracking developers, especially since 30% to 70% of them bypass standard analytics due to ad blockers and cookie restrictions . Beyond basic tracking, product analytics tools focus on metrics that matter most - like API key creation, time to first success, and recurring usage patterns that signal deeper engagement and adoption.
This specialized analytics stack doesn’t just track technical interactions; it transforms them into actionable insights. With consistent reporting, you can spot issues early through weekly reviews, uncover engagement trends monthly, and connect technical activity to revenue during quarterly analyses. For example, in 2025, PostHog’s focus on tracking GitHub interactions and API usage allowed them to predict conversions based purely on technical engagement . Traditional metrics like email open rates or social media impressions often miss these high-intent signals - such as how often code snippets are copied, how deeply documentation is explored, or how frequently API endpoints are used .
FAQs
What events should I track first for a developer product?
Tracking key developer engagement metrics is essential to understanding how users interact with your product. Pay close attention to factors like API call frequency, documentation views, and community activity. These metrics provide valuable insights that can guide your marketing strategies and help you enhance the overall developer experience.
How can I measure dark funnel word-of-mouth for my dev tool?
Tracking the dark funnel's word-of-mouth activity means keeping an eye on signals from hidden or less obvious channels that traditional tools often overlook. While it’s tough to measure directly, you can get a sense of what’s happening by watching for community-driven indicators like GitHub stars, activity on Discord or forums, and mentions on social media.
On top of that, digging into referral traffic and linking your advertising data with product analytics can help you spot patterns. For example, you might notice a connection between private conversations and a spike in signups or product usage. These insights help you piece together the impact of those harder-to-see discussions.
What should a developer marketing dashboard show leadership vs the team?
A developer marketing dashboard needs to address the priorities of both leadership and the team, tailoring its focus accordingly. For leadership, the dashboard should emphasize strategic KPIs that inform broader decisions. These might include metrics like share of voice, impressions, pipeline influence, customer acquisition cost, and revenue trends. These insights help guide the overall direction and assess the effectiveness of high-level strategies.
On the other hand, team dashboards should zero in on actionable metrics that directly support day-to-day operations. Examples include documentation visits, sandbox usage, community activity (like GitHub stars or Discord engagement), and ad-to-conversion tracking. These metrics provide the team with the data they need to fine-tune campaigns and improve user experiences.