
Developer marketing is different. Traditional metrics like impressions, MQLs, and click-through rates don't work well here. Why? Developers block ads, bypass cookies, and discover tools in ways that can't be tracked by standard analytics. Nearly 89% of tech companies struggle to measure success in this space. Here's what works instead:
- Focus on Product Usage: Metrics like API key activations, sandbox deployments, and "Time to First Hello World" (TTFH) are much better indicators of developer engagement than form fills or demo requests.
- Track "Dark Social" Activity: Over 52% of developer tool discovery happens in private Slack groups, Discord servers, or word-of-mouth. Use self-reported attribution to capture these channels.
- Measure Real Engagement: Monitor GitHub stars, documentation depth (pages viewed per session), and code snippet copies to gauge interest and intent.
- Prioritize PQLs Over MQLs: Product-Qualified Leads (PQLs) convert 3–5× higher than Marketing-Qualified Leads (MQLs), making them the gold standard for developer marketing.
- Use Privacy-First Tools: Traditional analytics miss up to 70% of developers due to ad blockers. Tools like Plausible, PostHog, and server-side tracking can fill these gaps.
Key takeaway: Focus on metrics that reflect how developers actually evaluate and adopt tools. Forget vanity metrics like impressions; track actions that lead to real outcomes, like product usage and activation milestones.
Awareness Metrics: Tracking Brand Visibility in Developer Communities
When trying to understand where developers engage with your brand, relying on standard B2B awareness metrics like impressions or ad reach just doesn’t cut it. Why? Because 30% to 70% of developers block traditional analytics tools, making it hard to track their behavior accurately . Instead, focus on where developers are actually spending their time - places like GitHub, Stack Overflow, Reddit, and technical documentation.
A big challenge here is that 52% of developer tool discovery happens through "dark social" channels. Think private Slack groups, Discord servers, and direct messages . These are completely invisible to UTM parameters or tracking pixels. To get a clearer picture, you’ll need to combine platform-specific metrics with self-reported attribution data.
Share of Voice in Developer Communities
To gauge your brand’s presence in developer spaces, track mentions across platforms like Reddit, Stack Overflow, Discord, and other technical forums. Set up keyword alerts or conduct manual searches weekly to capture when your tool is part of technical conversations. These mentions are a strong signal that your product is becoming part of the “shared team knowledge” .
Self-reported attribution is another way to fill in the gaps left by software tracking. Instead of dropdown menus, include an open-text field like "How did you hear about us?" during signup. This approach can uncover specific sources - podcasts, Slack threads, or conference talks - that dropdowns often miss .
"Software attribution misses: Podcast mentions, Slack recommendations, Twitter threads, Word of mouth, Conference encounters. Self-reported captures what people remember as influential." – sderosiaux, Developer Marketing Guide
Next, let’s look at how developers’ behavior on your documentation pages can provide even more insight.
Documentation Page Views
Engagement with your documentation is a strong indicator of developer interest and potential adoption . When developers dive into your workflow documentation beyond the landing page, they’re actively evaluating whether your tool can solve their problem. Track metrics like total page views and "documentation depth" - the number of unique pages viewed per session.
Here’s a compelling stat: Developers who view five or more unique documentation pages in their first session are 340% more likely to convert compared to those who only visit one page . Another useful signal? Monitor how often developers click the "copy" button on code blocks. This action often means they’re ready to test your code locally .
GitHub Stars Growth Rate
GitHub stars and repository views serve as benchmarks for how visible your tool is during developers’ code exploration. Use the "Insights → Traffic" tab in your GitHub repository to track weekly visitors and referrers. This data helps you understand whether your project is being discovered organically or through specific campaigns. Instead of focusing on the total number of stars, pay attention to the growth rate. A steady increase signals ongoing interest, while spikes can point to successful marketing efforts .
Mentions in Tech Forums
Technical forums can offer additional insights into your brand’s visibility during key moments, like troubleshooting or learning new skills. For example, you can monitor Stack Overflow question views, Reddit threads, and Discord discussions. These platforms often highlight when developers are encountering problems or exploring new technologies. Tracking the view counts on Stack Overflow questions that mention your tool can show how often your brand appears during these critical moments .
| Visibility Signal | What It Measures | Method |
|---|---|---|
| GitHub Repo Views | Discovery during code exploration | GitHub Insights → Traffic tab |
| Stack Overflow Views | Visibility during troubleshooting | Monthly log of view counts on relevant URLs |
| Community Mentions | Acknowledgment in technical conversations | TrackReddit alerts, Slack/Discord keyword searches |
| Documentation Depth | Intent to understand workflow | Analytics tracking of page path depth |
For developers who block traditional tracking scripts, consider using privacy-first tools like Plausible or PostHog. These tools rely on server-side tracking, bypassing client-side ad blockers and providing more accurate data on documentation engagement and site navigation .
These metrics lay the groundwork for understanding deeper levels of developer engagement, which we’ll explore next.
Engagement Metrics: Measuring Developer Activity
After understanding visibility metrics, the next step is evaluating how developers transition from being passive observers to actively engaging with your product. Engagement metrics help determine if developers are not just aware of your tool but are testing and integrating it into their workflows. These metrics focus on actions that reflect genuine intent to explore your product in a practical setting.
The pivotal moment often occurs when a developer takes a step like generating an API key or credential. This action signals a shift from simply browsing to actively preparing for a trial. From this point, tracking their journey - such as how quickly they achieve their first functional setup and how deeply they interact with your product - becomes essential.
API Key Signups
The creation of an API key is a strong indicator that a developer is moving beyond curiosity and is ready to test your product. It demonstrates they are prepared to authenticate and run your code in their environment. By tracking API key signups and the time it takes from visiting documentation to creating a key, you can assess how clear and effective your onboarding process is.
Additionally, cross-referencing API key signups with attribution data can reveal which marketing channels are bringing in the most engaged developers. This kind of analysis is particularly important in developer marketing, where the time from awareness to action can be longer.
Sandbox Activations
While API key creation is a great first step, it doesn’t always mean the developer has used it. This is where sandbox activations, or "First working setup", become critical. This metric confirms that the developer has successfully set up your tool and reached a basic functional state.
One key measure here is Time to First Success (TTFS) - the time it takes for a developer to go from starting the setup to achieving their first "aha moment." Benchmarks for TTFS vary depending on the type of tool:
| Tool Type | Healthy TTFS |
|---|---|
| Auth / API client libraries | 5–15 minutes |
| Framework or SDK integration | 15–45 minutes |
| Infrastructure or deployment tools | 45–90 minutes |
If developers exceed these benchmarks, it could indicate friction in your onboarding process.
"Time to First Hello World... [is a] proxy for how smooth the try-out experience is. Great activation metric candidate." – sderosiaux, Developer Marketing Guides
Docs Time-on-Page
Time spent on technical documentation pages can reveal a lot about developer engagement. High time-on-page suggests that developers are actively working to understand your workflows and implementation details. Metrics like navigation patterns and scroll depth can show whether they move beyond introductory pages into more advanced content.
Another strong signal is tracking "copy code" events. When developers use the copy button on code snippets, it indicates they’re preparing to test your product locally. This action shows a higher level of intent than simply viewing the page, as it suggests they’re ready to run your code in their environment.
Community Contributions
Once developers begin contributing bug reports, opening GitHub issues, or participating in forums, they’ve moved from evaluation to active advocacy. These contributions not only show adoption but also signal a deeper commitment to your tool.
To track these signals, monitor GitHub Insights for pull requests and issues, set up keyword alerts for mentions on platforms like Reddit and Stack Overflow, and keep tabs on activity in Slack or Discord communities. Developers who contribute at this level often become "power users" and can organically promote your product through peer recommendations.
"DevRel Qualified Leads allow you to keep track of who did what and to attribute value to tasks, so that you can more easily see what works and what doesn't in your campaigns." – Mary Thengvall, Director of Developer Relations, Camunda
Developers who transition from passive users to active contributors are invaluable. They provide critical feedback and often become your most effective advocates through word-of-mouth recommendations. These engagement metrics set the stage for connecting developer activity to revenue, which will be explored in the next section.
Pipeline Metrics: Connecting Developer Activity to Revenue
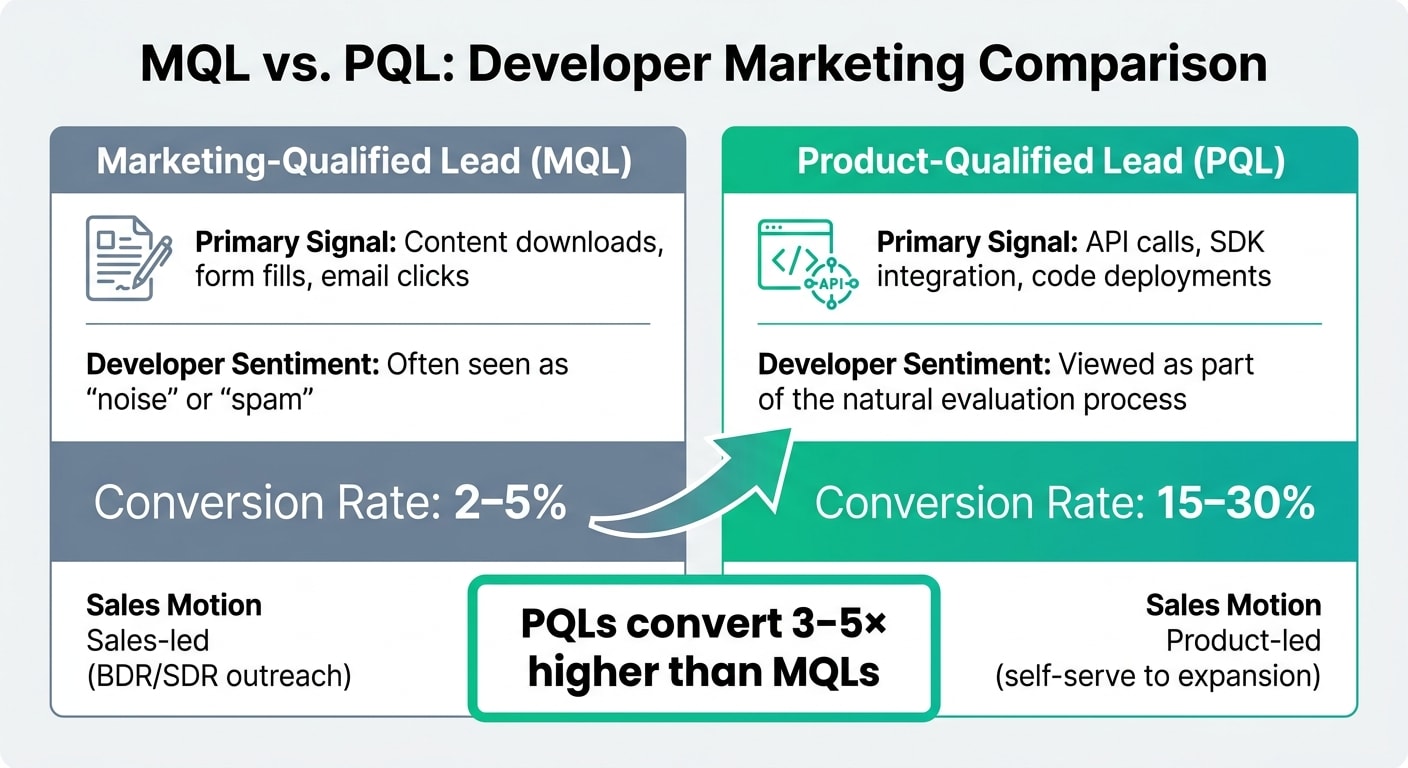
After understanding developer engagement, the next step is to connect those interactions to revenue. This is where Product-Qualified Leads (PQLs) come into play. Unlike Marketing-Qualified Leads (MQLs), which rely on passive indicators like form submissions or email clicks, PQLs are based on actual product engagement - things like completing an SDK implementation, running a successful code sample, or inviting teammates to collaborate .
The difference in conversion rates is dramatic. Developer-focused products see 3–5× higher conversion rates with PQLs compared to MQLs. Leading companies report PQL-to-customer conversion rates of 15–30%, while MQLs only convert at 2–5% . This makes sense when you consider that developers often prefer hands-on testing over traditional sales methods .
"Product Qualified Leads (PQLs) represent the gold standard for developer audience measurement. Unlike marketing qualified leads that rely on form submissions and email engagement, PQLs identify users who have demonstrated meaningful product engagement."
– Jono Bacon, Founder, Stateshift
Product-Qualified Leads (PQLs)
To define your PQL criteria, start by identifying the specific actions that indicate a developer is finding value in your product. These could include:
- Completing an SDK integration
- Running successful code samples
- Inviting team members to a workspace
- Reaching usage milestones like a set number of API calls
For example, Datadog (March 2026) identifies a PQL as a user who sends at least 100 monitoring events and remains active for over seven days. This approach has led to a 22% PQL-to-paid conversion rate . Similarly, Vercel (April 2026) focuses on getting developers to complete a "Hello World" demo in the first five minutes, using it as the kickoff point for their PQL pipeline .
| Feature | Marketing-Qualified Lead (MQL) | Product-Qualified Lead (PQL) |
|---|---|---|
| Primary Signal | Content downloads, form fills, email clicks | API calls, SDK integration, code deployments |
| Developer Sentiment | Often seen as "noise" or "spam" | Viewed as part of the natural evaluation process |
| Conversion Rate | 2–5% | 15–30% |
| Sales Motion | Sales-led (BDR/SDR outreach) | Product-led (self-serve to expansion) |
Once you've identified PQLs, tracking their journey through self-serve conversion funnels becomes key.
Self-Serve Conversions
Self-serve conversions mark the shift from free tiers or trials to paid plans, all without direct sales involvement. Developers increasingly favor this approach, which aligns with product-led growth (PLG) strategies . For developer tools, free-tier-to-paid conversion rates typically range from 2% to 6% .
"Free tier + self-serve signup + in-product usage metrics. Developers decide to use your tool before they talk to anyone."
– Louis Corneloup, Founder, Dupple
Tracking this funnel is essential. Key milestones include documentation visits, API signups, the first successful call, and daily usage. The "Minute 0–30" experience is crucial: aim for a "Hello World" moment within five minutes and a completed real task within 30 minutes to ensure activation . If a user hits milestones like connecting an integration or inviting teammates between Day 3 and Day 7, automated sales handoffs can trigger enterprise-tier conversations .
These self-serve signals also set the stage for deeper product adoption and revenue growth.
Expansion Revenue from Developer-Adopted Accounts
Beyond initial conversions, ongoing engagement drives expansion revenue through increased usage and team growth. This can include adding more seats, increasing API call volume, or upgrading from self-serve to enterprise plans . Marketing plays a critical role in this by promoting feature adoption and creating awareness of advanced capabilities .
To identify expansion opportunities, track "activation" metrics like feature usage or integrations connected. Also, monitor visits to pricing pages, terms of service, and advanced feature documentation as indicators of intent . Regularly review enterprise customer journeys to ensure marketing and sales teams are aligned on driving account growth .
Because traditional analytics tools like Google Analytics miss at least 30% of a developer audience due to ad blockers - and up to 70% when cookie consent is required - consider implementing self-reported attribution. Asking "How did you hear about us?" during onboarding can help capture insights from "dark social" channels like Slack, podcasts, and word-of-mouth that often go untracked .
Ad Campaign Metrics: Measuring Developer Ad Performance
Now that we've linked developer activity to revenue, it's time to dive into measuring the effectiveness of ad campaigns aimed at developers.
Why Standard Metrics Fall Short
Traditional metrics like impressions and click-through rates aren't enough when evaluating developer-focused campaigns. These numbers fail to reflect actual engagement, especially since developers often use ad blockers or avoid cookies, making standard tools miss a big chunk of this audience.
"Impressions are the worst vanity metric you can think of. Someone scrolling past your social media post without properly noticing it still counts as an impression."
– Milica Maksimović, Co-founder and COO, literally.dev
Instead of relying on these surface-level numbers, focus on technical engagement signals - actions that show developers are actively interacting with your tools. For instance:
- Code sample copy events
- Depth of navigation through documentation
- Cloning starter repositories
These actions indicate developers are testing your tool in their own environment, which is far more meaningful than a mere page view .
Cost per Developer Signup
This metric helps measure how efficiently you're moving developers from discovery to the "Start" stage of your funnel. While it’s a useful proxy for acquisition cost, it only becomes actionable when paired with activation data . A signup shows interest, but the real question is whether that developer goes on to complete their first working setup.
Because developers interact with multiple touchpoints, it's easy to lose track of where they first heard about you. To address this, use self-reported attribution. Ask new users, "How did you hear about us?" during signup to capture insights into "dark social" channels like Slack, Discord, or podcasts - where 52% of developer tool discovery happens .
Cost per Active Trial
This metric takes things a step further by focusing on activation - the moment a developer successfully sets up and uses your tool. Activation signals include:
- Creating an API key
- Making the first successful API request
- Completing a Quickstart guide
"Signups are useful to track, but they matter most when they lead to first use. A signup shows interest. The key is what happens after it."
– Mohammed Tahir, Hackmamba
Track events like api_key_created or setup_success to monitor activation. If your activation rates are low, consider shifting resources to improve documentation or reduce Time to First Success - the time it takes for a developer to go from setup to a working result. Here are some benchmarks to aim for:
- 5–15 minutes for Auth/API libraries
- 15–45 minutes for Frameworks/SDKs
- 45–90 minutes for Infrastructure tools
Viewability on Developer Properties vs. Open Web
Developer-specific platforms like GitHub, Stack Overflow, and technical forums offer a unique advantage: they capture developers at the exact moment they're looking for solutions. Ads on these platforms tend to perform better than generic web ads because they align with problem-solving intent . Unlike passive browsing, developers on these sites are actively searching for tools or answers.
While advertising on developer platforms may come with a higher Customer Acquisition Cost (CAC) - ranging from $300–$800 - the intent-driven engagement often makes it worth the investment . To evaluate performance, prioritize micro-engagements such as documentation scroll depth or code block copy events instead of relying on impressions .
Solving Multi-Touch Attribution Challenges
A common issue for developer-focused companies is tracking the full customer journey. In fact, 76% of such companies struggle with multi-touch attribution . To address this, implement server-side tracking through authenticated API calls and product usage telemetry. This approach bypasses client-side ad blockers and provides a clearer picture of how developers engage with your campaigns, even when traditional analytics tools fall short .
Building a Real-Time Developer Marketing Dashboard
Once you’ve identified the key metrics for developer marketing, the next step is creating a real-time dashboard. This dashboard brings all your data together, providing a single view for quicker decisions and helping you spot issues before they escalate.
Analytics Tools for Developer Metrics
At the core of any developer marketing dashboard are product analytics tools. Platforms like Amplitude, Mixpanel, and Heap are widely used to track developer behavior, such as generating their first API key or completing a quickstart guide. If you’re looking for an open-source option, PostHog is a solid choice. It combines product analytics with session recording and feature flags, which appeals to developers who prioritize transparency.
To track community activity, tools like Common Room and Orbit monitor conversations happening on platforms like Discord, Slack, and GitHub. These tools help you capture the “dark social” discussions that traditional marketing tools often overlook. This is crucial for understanding how developers interact with your product in spaces where they feel more candid.
For documentation analytics, solutions like GitBook Analytics or Plausible provide insights into how developers navigate your documentation. They measure interactions like the time it takes to achieve a successful integration. Unlike Google Analytics, which many developers block with ad blockers, Plausible is lightweight and GDPR-compliant, making it more reliable for technical audiences .
"Only look at metrics that help you make decisions. If you track metrics and create dashboards but don't use them for decision-making, rethink your metrics."
– sderosiaux
With these tools in place, the next step is identifying the data sources to connect for a unified view.
Data Sources to Connect
To build a comprehensive dashboard, you’ll need to pull data from various sources. Start with the GitHub API to track stars, forks, and repository clones - key indicators of how developers are engaging with your code before committing to a trial. Pair this with your CRM system to monitor pipeline value and understand which developer actions lead to closed deals.
For discovery metrics, Google Analytics or Plausible can provide insights into web traffic. When it comes to ad performance, daily.dev Ads reporting offers developer-specific metrics like cost per active trial and ad viewability on technical platforms.
Because many developers use ad blockers, server-side tracking is a must. By implementing server-side tracking through your API gateway or SDKs, you can accurately capture data such as API call counts, successful integrations, and usage patterns over time.
Once your data streams are connected, the next step is designing dashboards tailored to different stakeholders.
Dashboard Layout Examples
Your dashboard design should cater to the needs of various stakeholders. Here’s how you can structure it:
- Executive Dashboards: Focus on high-level metrics like pipeline value, win rate, Net Dollar Retention (NDR), and blended Customer Acquisition Cost (CAC). These numbers help leadership understand the business impact and justify budget decisions.
- Manager Dashboards: Include operational metrics such as activation rate, Time to First Value (TTFV), channel ROI, and signup trends. These insights help managers optimize campaigns, smooth out the developer journey, and allocate resources effectively.
- DevRel and Community Dashboards: Highlight ecosystem health with metrics like GitHub stars, forks, documentation search success rates, and community response times. These indicators show whether your developer advocacy efforts are gaining traction or facing roadblocks.
| Dashboard Level | Key Metrics to Include | Primary Goal |
|---|---|---|
| Executive | Pipeline Value, Win Rate, NDR, Blended CAC | Justify budget and demonstrate business impact |
| Manager | Activation Rate, TTFV, Channel ROI, Signup Trends | Optimize campaigns and reduce friction |
| DevRel/Community | GitHub Stars/Forks, Documentation Search Success, Community Response Time | Measure ecosystem health and advocacy |
Finally, set appropriate refresh intervals. Real-time updates work best for tracking signup trends and active experiments. Monthly updates are ideal for full-funnel analysis and content performance, while quarterly reviews are better suited for program-level ROI and strategic decisions with leadership.
Reporting Developer Metrics to Leadership
When communicating developer metrics to leadership, the key is to link them directly to business outcomes like revenue growth and customer retention. Metrics only resonate with executives when they clearly demonstrate their financial impact.
Instead of relying on outdated MQLs (Marketing Qualified Leads), focus on developer-specific PQLs (Product Qualified Leads). These reflect meaningful actions such as API integrations or code sample executions, which are more aligned with developer engagement. For example, Datadog defined PQLs as users who sent at least 100 monitoring events and stayed active for more than 7 days. This approach led to a 22% PQL-to-paid conversion rate - a clear indicator of how developer engagement can drive financial results .
To make your case stronger, tie metrics to the outcomes leadership prioritizes. For instance, Time to First Value (TTFV) can signal early churn risks. Metrics like increased API call volume directly correlate with usage-based revenue growth. Similarly, Net Dollar Retention (NDR) for developer tools often ranges between 110-130%, primarily driven by increased usage rather than additional user seats . Highlighting these connections helps demonstrate how developer activity translates into measurable business success.
Another challenge is closing the attribution gap, especially for hard-to-track channels like dark social. To address this, incorporate self-reported data and adopt a weighted attribution model. For example, you could assign credit across the customer journey as follows: Discovery (15%), Evaluation (25%), Trial (35%), Validation (20%), and Purchase (5%) . This ensures a more accurate representation of how developers engage with your product.
Finally, establish a tiered reporting system to keep leadership informed. Weekly updates should focus on signup trends and ongoing experiments. Monthly reports can dive into full-funnel metrics and channel performance. Quarterly reviews should showcase detailed enterprise customer journeys, connecting marketing efforts to sales outcomes . This structured approach not only simplifies attribution but also highlights how developer marketing contributes to overall pipeline growth.
Conclusion
Developer marketing requires a fresh approach to measurement, one that moves beyond traditional B2B campaign frameworks. Unlike conventional buyers, developers evaluate and adopt tools through hands-on experimentation rather than through sales pitches, making standard metrics inadequate.
To connect developer activity with business outcomes, an actionable dashboard is essential. Pinpointing where developers drop off - whether during onboarding, API activation, or sustained usage - allows you to allocate resources more effectively. Companies that embrace specialized developer-focused measurement frameworks report 35% more precise ROI calculations and 28% better budget allocation efficiency .
Metrics that track progress from awareness to activation are the backbone of measurable ROI. For instance, strong engagement with documentation often leads to higher conversion rates . Similarly, Product-Qualified Leads (PQLs) play a crucial role in improving conversion success . A data-driven strategy eliminates guesswork, giving leadership a clear view of the value generated by developer engagement.
However, between 30% and 70% of developers may remain invisible to traditional analytics tools due to ad-blockers and privacy settings . Address these blind spots with server-side tracking, self-reported attribution, and privacy-conscious analytics platforms. The aim is to identify whether developers are moving through your funnel and to uncover any friction points along the way.
Start by focusing on metrics that guide your next decision, then gradually expand your dashboard as your program evolves. By concentrating on the right metrics, you can refine your developer marketing strategy over time. The frameworks discussed here offer a strong starting point for measuring what truly matters in developer marketing - not just what’s convenient to track.
FAQs
How do I define a PQL for my developer product?
A Product-Qualified Lead (PQL) for a developer-focused product is defined by how much a developer interacts with and adopts the product on a technical level.
Some key indicators of this include:
- Signing up for an API key
- Activating a sandbox environment
- Viewing technical documentation
These actions reflect that a developer is not just curious but actively testing and integrating your product into their workflow.
How can I measure “dark social” in developer discovery?
Tracking the impact of "dark social" channels - like Slack, email, or direct messages - can be tricky since they often leave no traceable digital footprint. To get a clearer picture, consider using self-reported attribution questions during signups or onboarding. Simply ask developers how they first heard about your product.
In addition to direct feedback, keep an eye on indirect signals. Look for mentions in forums, social media platforms, or GitHub repositories. These can provide valuable insights into how private sharing channels are influencing your product's visibility.
What should my first dev marketing dashboard include?
When setting up your first developer marketing dashboard, focus on metrics that truly measure developer engagement and adoption. Avoid getting distracted by vanity metrics like clicks, which don't provide a full picture of success.
Instead, include these key categories:
- Awareness metrics: These help you gauge how well your product is known in the developer community. Examples include share of voice, documentation views, and GitHub stars.
- Engagement metrics: These track how developers are interacting with your product. Keep an eye on API key signups and sandbox activations to understand real interest and usage.
- Pipeline metrics: These measure how developer interest translates into business outcomes. Metrics like PQLs (product-qualified leads) and self-serve conversions are essential for tracking growth.
To make the most of your dashboard, use tools like Amplitude or Mixpanel to monitor real-time data. Remember, the goal is to prioritize long-term engagement rather than just quick, short-term wins.