
Measuring developer marketing success requires a tailored approach. Unlike traditional buyers, developers follow non-linear paths, often invisible to standard analytics tools. This makes tracking their engagement a challenge. Here's the key: build a measurement stack that connects data across platforms like documentation, APIs, and GitHub, while focusing on meaningful metrics like PQLs (Product Qualified Leads) and Time to First Success (TTFS).
Key Takeaways:
- Developers are hard to track: Up to 70% may block analytics tools using privacy-focused browsers or ad blockers.
- Focus on actionable metrics: Track PQLs, TTFS, API key generation, and documentation engagement instead of vanity metrics like impressions.
- Privacy-first tools are essential: Use server-side tracking and GDPR-compliant analytics to fill gaps.
- Map the developer journey: Identify milestones like discovery, trial, and validation to align metrics with behavior.
- Self-reported data matters: Add "How did you hear about us?" fields to capture insights from dark social channels like Slack and Discord.
By aligning your tools, metrics, and goals, you can create a system that tracks developer engagement effectively and ties it to revenue outcomes.
Setting Goals and Developer-Specific Metrics
Aligning Business Goals with Campaign Objectives
To achieve measurable results, your measurement stack needs to align with both business goals and the unique developer journey. One common pitfall in developer marketing is focusing on activities like impressions, clicks, and page views rather than outcomes like revenue, product adoption, or retention.
The solution? Start with a cross-functional conversation. Collaborate with sales, growth, and product teams to define what a "Qualified Signup" looks like for your product. Is it someone who generates an API key? Completes the quickstart guide? Invites their team? Without this shared understanding, marketing and sales risk working toward entirely different goals.
Once aligned, shift from MQLs (Marketing Qualified Leads) to PQLs (Product Qualified Leads). PQLs better reflect meaningful developer engagement - users who’ve taken key actions within your product. For developer-focused products, PQLs typically convert at 3–5 times the rate of MQLs . As Jakub Czakon, CMO at a dev tool startup, explains:
"You treat it as a product and measure ROI at a program level. You optimize activities within the programs but don't report ROI on them."
In practice, this means you evaluate the ROI of your entire documentation program or developer community instead of obsessing over whether one blog post led to a sale. With clear outcomes in place, map the developer journey to identify critical behavior milestones.
Mapping the Developer Journey
Unlike a traditional B2B funnel, the developer journey is technical, nonlinear, and often spans several months. Mapping it requires pinpointing the specific behaviors that indicate progress at each stage.
| Stage | Developer Behavior | Key Metrics |
|---|---|---|
| Discovery | Reads technical blogs, finds repo | GitHub repo views, branded searches, Stack Overflow mentions |
| Evaluation | Browses docs, watches tutorials | Documentation page views, tutorial completion rate |
| Trial | Runs code, creates API key | API key generation, Time to First Value (TTFV), PQL status |
| Validation | Deploys to production | Production deployments, team invitations, API call volume |
| Expansion | Scales usage, upgrades plan | Net Dollar Retention (NDR), usage-based growth, revenue pipeline |
Pay special attention to the Trial stage, where streamlined onboarding is crucial. For instance, enabling deployments in under 15 minutes for freemium products can make a big difference. Similarly, the Discovery stage deserves focus, as 52% of interactions happen through dark social channels . A simple addition like a "How did you hear about us?" field on your signup form can help you capture these otherwise invisible touchpoints.
By identifying these stages, you can set precise KPIs that reflect both immediate developer actions and long-term outcomes.
Key Developer Marketing KPIs to Track
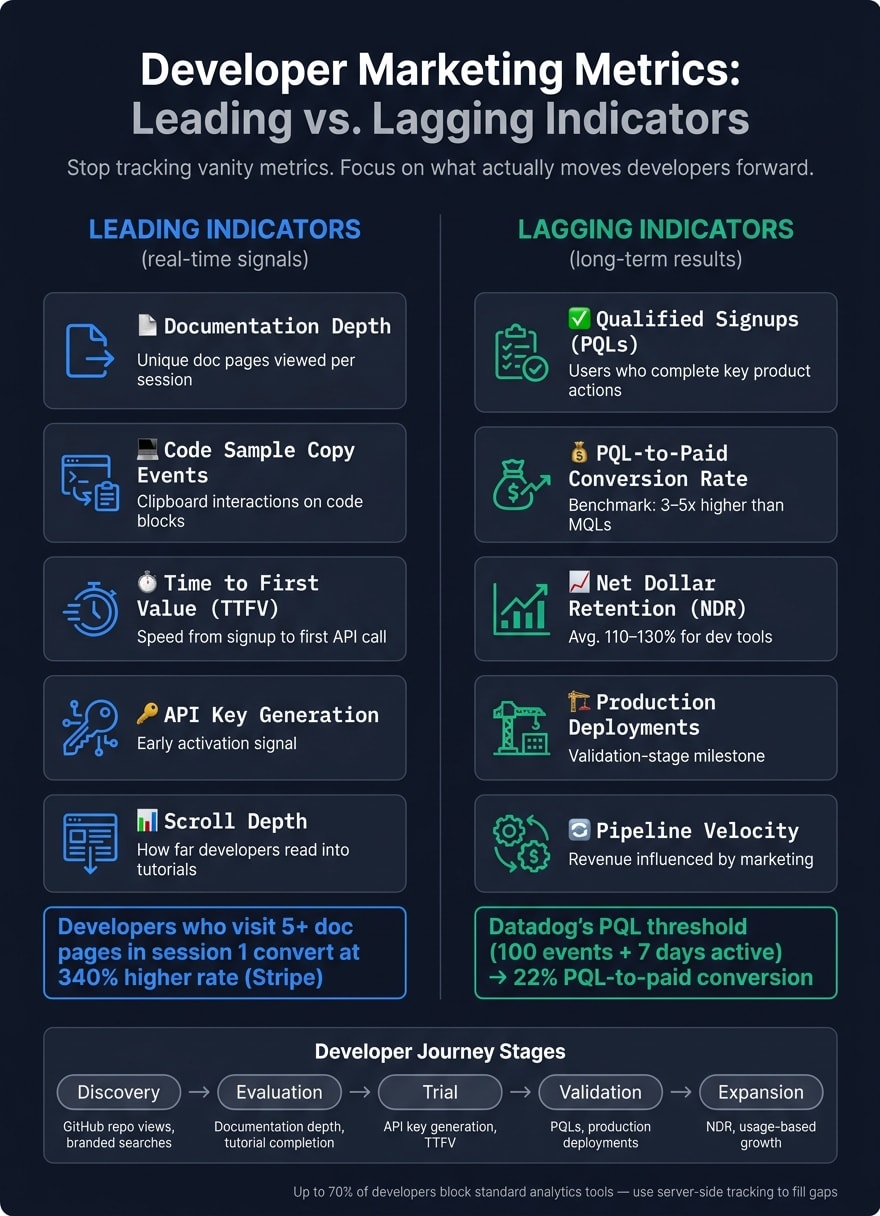
To make informed decisions, it’s essential to distinguish between leading indicators (real-time signals) and lagging indicators (long-term results). Leading indicators help you adjust your strategy on the fly, while lagging indicators confirm its overall success.
For real-time insights, track metrics like documentation depth (how many unique documentation pages a user views), code sample copy events, and Time to First Value (TTFV). For example, Stripe found that developers who visit 5 or more unique documentation pages in their first session convert at a rate 340% higher than those who visit just one page . This kind of data provides a clear signal of developer intent.
For executive-level reporting and budget planning, focus on lagging metrics like Qualified Signups, PQL-to-paid conversion rates, and Net Dollar Retention (NDR). For developer tools, NDR often averages between 110% and 130%, driven largely by usage growth rather than traditional upsells .
"Impressions are the worst vanity metric you can think of. Someone scrolling past your social media post without properly noticing it still counts as an impression." - Milica Maksimović, Co-founder and COO, Literally.dev
A great example of this approach is Datadog. They define a PQL as a user who sends at least 100 monitoring events and stays active for over 7 days. This specific threshold has enabled them to achieve a 22% PQL-to-paid conversion rate , serving as a solid benchmark for evaluating your product's activation criteria.
How to Build an Integrated Analytics Stack
Tools for Data Collection and Tracking
These days, many developers disable client-side tracking, which means relying on it alone can leave your data incomplete.
The solution? A two-step approach. First, use privacy-focused analytics tools like Plausible (starting at $9/month). These tools are less likely to be blocked by browser extensions . Second, add server-side tracking to capture the events that client-side scripts might miss. For instance, if you're working with technical content, consider tracking how far users go into your documentation. It’s worth noting that users who read beyond setup instructions are four times more likely to convert .
Another critical step is standardizing your UTM taxonomy from day one. Create a strict, version-controlled list for values like source, medium, and campaign names. Why? Without it, you risk having fragmented data where “YouTube,” “yt,” and “youtube” are treated as separate sources, making it a headache to accurately measure performance .
"Treat UTM automation like source control for marketing data. The more you standardize at the point of creation, the less cleanup you need in reporting." - Jordan Vale, Senior SEO Content Strategist
Once your data collection is in place, the next move is to dig deeper into how developers interact with your product.
Product and Behavioral Analytics
After setting up reliable tracking, it’s time to explore what developers are actually doing inside your product. Tools like PostHog (free for up to 1 million events/month) can help you track key technical milestones that show real activation - going beyond just logins or page views. These insights are vital for completing the picture of your analytics stack.
One essential metric to track is Time to First Success (TTFS), which measures how long it takes a developer to go from starting your Quickstart guide to making their first successful API call. While benchmarks vary depending on the kind of tool you offer, here’s a general idea :
| Tool Type | Target Time to First Success |
|---|---|
| Auth / API Libraries | 5–15 minutes |
| Framework / SDK | 15–45 minutes |
| Infrastructure Tools | 45–90 minutes |
Beyond TTFS, you should also monitor key actions like API key creation, copying code samples, and CI/CD integration. When developers start embedding your tool into their workflow, it’s a strong indicator of long-term retention.
The next challenge is linking these actions to revenue.
Attribution and Revenue Connection
Once you’ve gathered behavioral data, connecting it to revenue becomes essential. This step is often tricky, especially in developer marketing, where sales cycles can exceed 90 days. One common mistake is sticking to default 30-day attribution windows, which can undervalue top-of-funnel content that sparks early engagement .
For most B2B developer tool companies, a U-shaped attribution model works well. This model assigns 40% of the credit to the first interaction, 40% to lead creation, and 20% to the middle touchpoints . It strikes a balance between awareness and conversion while accounting for the long, nurturing process developers often require.
To make this model actionable, ensure every marketing-sourced lead carries its original UTM parameters into your CRM. Then, make sure deal outcomes - like revenue and close dates - sync back into your analytics tools. This bi-directional flow helps solve a common issue:
"Every quarter the CMO presents campaign performance numbers, the CFO asks how those numbers connect to revenue, and nobody has a convincing answer." - KISSmetrics Editorial
Finally, pair software-based attribution with a self-reported "How did you hear about us?" field on high-intent forms. Since 52% of developers discover tools through dark social channels like private Slack groups or word-of-mouth , relying only on software can leave gaps. In fact, companies without reliable attribution waste an average of 26% of their marketing budgets on underperforming channels . Self-reported data is a simple, cost-effective way to fill those gaps.
How to Track Developer Engagement Across Channels
This stage goes beyond simple data collection, ensuring that every interaction - whether it's an ad click or a product integration - is thoroughly measured. To do this effectively, you’ll need to activate your measurement tools across all developer-focused channels.
Tracking Ad Campaign Performance
When running ad campaigns aimed at developers (like using platforms such as daily.dev Ads, which places native ads directly in the feeds of over 1 million developers), it's essential to standardize your UTM naming conventions. For instance, tagging one campaign as source=dailydev and another as source=daily_dev can create fragmented data streams that are impossible to unify.
Beyond basic metrics like impressions, look at more meaningful signals. Are developers clicking through to explore your documentation or generating API keys? These downstream actions provide far better insight into the actual quality of your campaign.
Once you’ve tracked ad performance, the next step is to focus on how developers engage with your documentation.
Measuring Documentation and Learning Engagement
To understand how effective your documentation is, track metrics like scroll depth, code block copies, and page path depth. These indicators reveal whether developers are deeply engaging with your content or just skimming through it.
- Scroll depth: This tells you how far developers are scrolling, helping you identify whether they’re sticking around or leaving quickly.
- Page path depth: By tracking the
docs_page_path_depth, you can see how many pages a developer navigates in a single session. This metric shows whether they’re exploring your workflow in detail or only scratching the surface . - Code block interaction: Adding a
copy_code_sampleclick event to every code block allows you to measure how often developers use the "Copy to Clipboard" feature, signaling their intent to test code locally .
"The purpose of developer marketing metrics is to understand whether developers are progressing forward. If they are not, the work is to find where friction is happening and reduce it." - Mohammed Tahir, Author, Hackmamba
In addition to analytics, tools like Hotjar or Lucky Orange can offer heatmaps to visualize where developers slow down or abandon a tutorial. These insights can help you identify and address points of friction before they affect conversions .
Monitoring API and SDK Adoption
Once you’ve assessed content engagement, the next step is to track product adoption to measure long-term success. Log critical events like api_key_created, setup_started, and setup_success . The time it takes to move from setup_started to setup_success - known as Time to First Success (TTFS) - is a key metric for understanding retention.
For SDK adoption, package manager dashboards (like npm, pip, Go, or NuGet) provide data on download volumes, which can act as early indicators of developer interest and evaluation . Combine this with server-side API logs grouped by endpoint or feature to monitor how deeply developers are engaging with your product over time. Frequent interaction with multiple endpoints usually signals deeper integration.
Finally, track Monthly Active Developers (MAD) - developers who make at least one authenticated API call within a month . Unlike seat counts or logins, this metric gives a clearer picture of retention and validates the success of your engagement efforts from earlier stages.
Building Dashboards and Reports for Stakeholders
Once you’ve gathered data from various channels, the next step is to transform it into insights tailored to each stakeholder. A common pitfall is creating a single dashboard to serve everyone - executives, marketers, and engineers all need different perspectives on the same data.
Executive Dashboards
Executives are focused on outcomes, not day-to-day activities. Their dashboards should highlight lagging metrics - the results that tie marketing efforts directly to business performance. These metrics might include revenue influenced, Customer Acquisition Cost (CAC), Lifetime Value (LTV), and pipeline velocity.
To provide accurate insights, consider implementing the U-shaped attribution model discussed earlier. This method avoids overemphasizing the last click while neglecting the importance of initial awareness efforts. Additionally, ensure the dashboard integrates directly with CRM deal outcomes. Without a bi-directional sync, you might end up tracking leads instead of revenue, which doesn’t give a full picture of success .
Marketing Performance Dashboards
While executives care about end results, marketing teams need to monitor leading metrics that signal early success. These might include:
- Cost per qualified signup
- Funnel conversion rates by channel
- Engagement depth with documentation
- Trends in branded search volume
One often-overlooked but crucial element is a self-reported attribution field - a simple "How did you hear about us?" question at signup. This qualitative data is invaluable, as up to 52% of developer tool discovery occurs in places like private Slack groups, Discord servers, and direct messages - channels that analytics tools can’t track .
As Jakub Czakon, CMO of a dev tool startup, points out:
"Don't treat LinkedIn engagement as a lagging metric that you report to your CEO. They don't really care about that."
Before building this dashboard, ensure there’s alignment across marketing, sales, and product teams on what defines a "qualified signup." Without this shared understanding, your metrics could tell conflicting stories .
Product and Engineering Analytics Views
For product and engineering teams, dashboards should focus on activation metrics like Time to First Success (TTFS) - the time it takes users to go from starting setup to achieving a working result. Healthy TTFS benchmarks depend on the type of tool:
| Tool Type | Healthy TTFS Benchmark |
|---|---|
| Auth / API client libraries | 5–15 minutes |
| Framework or SDK integration | 15–45 minutes |
| Infrastructure or deployment tools | 45–90 minutes |
Source:
Beyond TTFS, track metrics such as API key creation rates, activation rates (aim for 20–40%), and how deeply users adopt features . Adding behavioral alerts can further enhance these dashboards. For example, setting up notifications for sales when a prospect visits the pricing page three times in one week can bridge the gap between product analytics and revenue opportunities .
Finally, keep in mind that standard tracking tools often miss 30–70% of developer activity due to ad blockers . Using server-side tracking for authenticated API calls can ensure your dashboards remain accurate, even when client-side tracking falls short.
Conclusion: Building a Measurement Stack That Delivers Results
Creating a measurement stack that truly works starts with capturing the right data to make informed decisions. The key is alignment - matching your tools to your objectives, your metrics to the stages of your funnel, and your reporting to the needs of your audience.
It’s time to move beyond vanity metrics. As Milica Maksimović, Co-founder and COO of Literally.dev, explains:
"Impressions are the worst vanity metric you can think of... stop chasing big numbers and start asking harder questions."
Instead, prioritize metrics like Activated Signups, Qualified Accounts, and meaningful engagement signals over surface-level numbers like impressions. It’s also critical to recognize that many developers may not be trackable with standard tools due to ad blockers or consent restrictions. To address this, consider privacy-first, GDPR-compliant tools and integrate server-side tracking as part of your foundation.
At every stage of your funnel, your measurement stack should answer one straightforward question: Are developers moving forward? Mohammed Tahir, Author at Hackmamba, puts it succinctly:
"The purpose of developer marketing metrics is to understand whether developers are progressing forward. If they are not, the work is to find where friction is happening and reduce it."
This approach ensures that every metric you track contributes to progress and actionable insights. Tools like daily.dev Ads help by connecting your campaigns with over 1 million developers actively searching for solutions, giving you a high-quality signal from the very start. By aligning your goals, metrics, and tools, your measurement stack transforms into a powerful driver of developer success.
FAQs
What should count as a PQL for my developer product?
A Product Qualified Lead (PQL) for a developer product is a developer or technical user who actively engages with the product in ways that suggest they're likely to convert. These users stand out through meaningful actions, such as:
- Completing the onboarding process.
- Integrating the product into their workflows.
- Regularly using core features.
These behaviors highlight that the user is finding real value in the product, making them strong candidates for targeted sales outreach or onboarding efforts.
How can I measure developer engagement if most users block analytics?
Measuring developer engagement when analytics are blocked means relying on alternative metrics and indirect signals. Focus on tracking key actions such as API call frequency, documentation views, SDK implementation rates, feature activation, and onboarding completion.
You can also gauge technical adoption and community growth by examining SDK usage patterns, API behaviors, and collecting qualitative feedback through community participation. These indicators serve as effective substitutes for traditional tracking, offering valuable insights into developer interaction and engagement.
How do I connect docs and API activity to revenue over long sales cycles?
Tracking developer engagement metrics is essential to understanding adoption and interest. Keep an eye on API call frequency, GitHub activity, and documentation views - these can reveal how developers are interacting with your tools and resources.
On the product side, focus on usage indicators like SDK implementation rates and feature activation. These metrics help you assess where users are in the adoption funnel and how effectively they're progressing.
To connect the dots between technical engagement and business outcomes, implement attribution strategies. These will help you tie long-term developer activity to key revenue-driving actions, even when sales cycles are lengthy and complex. This ensures your technical efforts are aligned with broader business goals.