Measuring ROI for developer ad campaigns is challenging but essential. Developers follow long, fragmented journeys, often influenced by untrackable interactions in the "dark funnel" (e.g., Slack, Discord, word-of-mouth). Plus, with 67% of developers using ad blockers, traditional tracking tools fall short.
Here’s how to measure ROI effectively:
- Trackable Metrics: Use UTM parameters, extended attribution windows (30–90 days), and activation events (e.g., first API call).
- Dark Funnel Insights: Use self-reported attribution surveys and monitor community mentions (e.g., GitHub stars, Reddit discussions).
- Platform-Specific Tracking: Tailor metrics to platforms like Stack Overflow, GitHub, and daily.dev.
- Attribution Models: Choose between first-touch, last-touch, time-decay, or multi-touch models to credit developer touchpoints.
- Clear Reporting: Focus on actionable metrics (e.g., cost per trial, trial-to-paid conversion rates) and present ROI in financial terms.
Why Developer Ad Campaigns Are Different
Multi-Touch Journeys and Developer Behavior
When it comes to developers, their journey from discovering your product to actually converting can be a long and fragmented process - often stretching across 6–12 months . A developer might spot your ad on a platform like daily.dev, check out your GitHub repository without logging in, browse your documentation anonymously, discuss your tool in a Discord group, and only later create an account. This scattered path makes it nearly impossible for traditional attribution tools to track every step accurately. Add in the fact that these interactions might span multiple environments like an IDE, CLI, browser, or mobile device, and the challenge becomes even more complex .
Complicating things further is the technical friction developers bring to the table. For instance, 67% of developers use ad-blockers, and cookie restrictions often obscure their activity. What your analytics tool might label as "direct traffic" could actually be the result of weeks of in-depth research and discussions that went completely unnoticed. The open-source model adds another layer of complexity, reshaping the traditional marketing funnel in unexpected ways .
Open-Source and Free Trial Models
Open-source and free trial models don’t follow the typical marketing playbook. Instead of collecting leads through gated content, developers can directly download your tool, clone your GitHub repo, or start a free trial - all without ever providing their contact information. This creates an extended anonymous research phase, during which developers evaluate your product long before you even know they’re interested .
In most companies, marketing teams handle acquisition - getting signups - while the product or growth teams take over when it comes to converting those signups into paying customers. This is because the shift from free to paid often depends on factors like the quality of technical documentation, API performance, and how quickly a user can reach their "First Hello World" moment .
Measuring ad ROI in this environment isn’t as simple as looking at revenue. Instead, you’ll need to focus on activation metrics - like how quickly users make their first API call - as indicators of potential conversions. For example, if your historical free-to-paid conversion rate is 1%, your annual customer value is $5,000, and your average retention is 2 years, then each free signup is worth about $100 (1% × $5,000 × 2) . This anonymous evaluation phase feeds directly into what’s known as the dark funnel.
The Dark Funnel Problem
The "dark funnel" refers to all those hidden interactions that happen outside the reach of traditional attribution tools. Think private Slack channels, Discord groups, podcast mentions, Twitter threads, or GitHub discussions. These touchpoints are invisible to most analytics platforms, which means they often go unaccounted for .
By the time a developer finally converts, your analytics might credit the last ad they clicked. But the real turning point could have been a trusted recommendation in a private Slack group. Social media sentiment tools that attempt to track these interactions are only about 60–70% accurate, leaving you with an incomplete picture . This is where self-reported attribution becomes a valuable tool for understanding what actually influenced a developer’s decision .
| Dark Funnel Channel | Tracking Challenges | Recommended Proxy Metric |
|---|---|---|
| Slack/Discord | Private, closed communities | Self-reported attribution surveys |
| Podcasts | No clickable links in audio | Unique promo codes or vanity URLs |
| GitHub/Open Source | Anonymous browsing/cloning | Star growth or community mentions |
| Word of Mouth | Happens offline or in DMs | Brand search lift (Google Trends) |
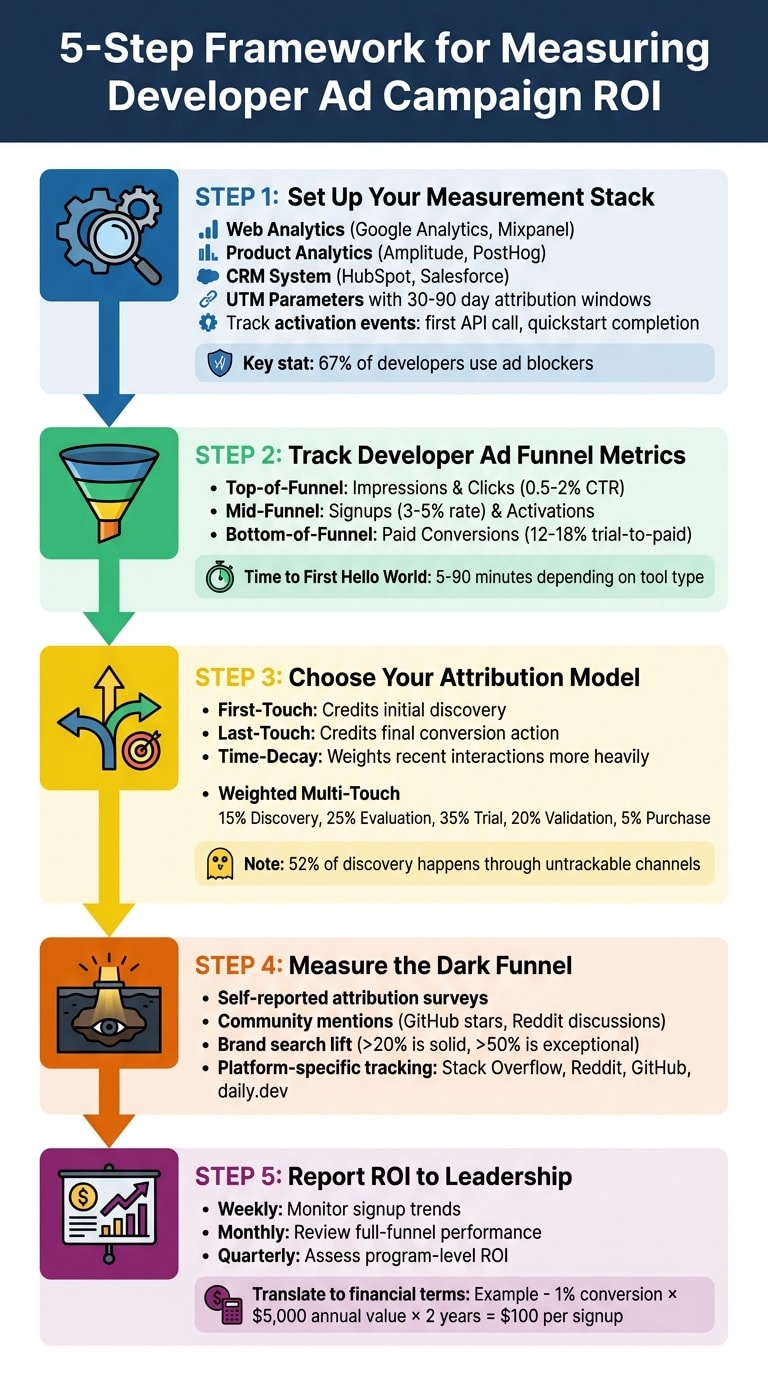
Step 1: Set Up Your Measurement Stack
Building a solid measurement stack is crucial for connecting ad clicks to paid conversions . This stack should include web analytics tools like Google Analytics or Mixpanel, product analytics platforms such as Amplitude or PostHog, and a CRM system like HubSpot or Salesforce. Together, these tools help you track the entire journey from the initial ad click to a paid conversion . Since developers often spend time engaging with documentation, integrating tools like ReadMe, Swagger, or Redocly can help you monitor API endpoint usage and documentation engagement . This setup forms the backbone for measuring developer ad funnel metrics and calculating ROI accurately.
UTM Parameters and Naming Conventions
Accurate tracking starts with consistent UTM tagging. Use a structured naming convention like:
- utm_source=dailydev
- utm_medium=native-ad
- utm_campaign=q2_api_security_launch
to ensure your CRM can effectively filter and analyze results. For developer-focused campaigns, it’s smart to extend attribution windows to 30–90 days (instead of the typical 7–14 days) since developers often take longer to evaluate tools. Shorter windows risk missing conversions . Beyond tracking clicks, keep an eye on high-intent pageviews - visits to your pricing page, terms of service, or contact form - since these actions signal users nearing a conversion . A well-implemented tagging strategy ensures smooth integration with your CRM and better conversion tracking.
Conversion Tracking and CRM Integration
Focus on tracking activation events like the first API call, completing a quickstart guide, or connecting an integration. These milestones indicate real engagement and are far more telling than simple email opens . Your CRM should capture both software-tracked data (such as UTMs and cookies) and self-reported attribution from a "How did you hear about us?" field during signup. To account for random or misclicked responses, include a fake option like "Billboards" in the dropdown menu . Once conversion tracking is set up, enhance your methods with privacy-friendly tools to address engagement lost to ad blockers.
Privacy-First Tracking Methods
With 67% of developers using ad blockers, traditional pixel-based tracking often fails . Platforms like Daily.dev offer built-in, real-time analytics that don’t rely on cookies or third-party scripts, making it possible to track engagement even when ad blockers are active. Metrics like time on page, scroll depth, and click-through rates provide valuable insights. For anonymous visitors from high-value accounts, tools like Koala can help identify companies browsing your site before they fill out a form . These privacy-first techniques ensure you can still capture meaningful engagement data, even with the tracking challenges posed by developer audiences.
"Only look at metrics that help you make decisions. If you track metrics and create dashboards but don't use them for decision-making, rethink your metrics." - sderosiaux, Author of Developer Marketing Guides
Step 2: Track Developer Ad Funnel Metrics
Once your measurement stack is ready, it’s time to track three critical stages: Discovery, Activation, and Adoption. Unlike traditional B2B funnels, developers often explore your product anonymously - digging into documentation, cloning repositories, or testing code - long before filling out any forms. Knowing what success looks like at each stage helps you identify where users drop off and fine-tune your spending. This structured approach ensures every stage contributes to better optimization and validates your campaign investments.
Top-of-Funnel: Impressions and Clicks
Start by tracking impressions and clicks to measure your campaign’s visibility. Developer-focused campaigns tend to see click-through rates (CTRs) ranging from 0.5% to 2%, depending on the ad format and placement . For example:
- Display ads average around 0.3% CTR.
- Native ads perform better, with CTRs around 1.2%.
- In-IDE ads can hit up to 2.1% CTR.
Top-performing native placements may even reach 2.5% or higher . Beyond these basic metrics, dive deeper into engagement by tracking documentation scroll depth and code snippet copy events - both are strong indicators of user intent .
Mid-Funnel: Signups and Activations
At this stage, focus on signups and activation events, such as creating an API key, installing an SDK, or completing a quickstart guide. Signup rates typically range from 3–5%, but the best campaigns can achieve rates between 8–15% . Another key metric to monitor is Time to First Hello World - how long it takes users to go from signup to successfully using your product. Benchmarks for this vary by tool type:
- 5–15 minutes for authentication or API client libraries.
- 15–45 minutes for frameworks or SDKs.
- 45–90 minutes for infrastructure tools .
This metric highlights how effective your onboarding process is.
"Signups are useful to track, but they matter most when they lead to first use. A signup shows interest. The key is what happens after it." - Mohammed Tahir, Hackmamba
Once your activation metrics confirm user engagement, you can shift your focus to the bottom of the funnel.
Bottom-of-Funnel: Paid Conversions and CAC
At the bottom of the funnel, the focus is on paid conversions and customer acquisition cost (CAC). Trial-to-paid conversion rates typically fall between 12–18%, with top-performing campaigns reaching as high as 25–35% . To calculate CAC, divide your total ad spend by the number of paying customers.
You can also track high-intent pageviews to identify users who are close to making a purchase decision. To further justify your ad spend, assign a dollar value to each signup by multiplying your signup-to-paid conversion rate by the average customer lifetime value . This helps you make smarter decisions about where to invest for better results.
Step 3: Choose Your Attribution Model
Once you've mapped out the detailed funnel metrics, the next step is to decide how to assign credit to each developer touchpoint. Developers often have a long, multi-channel journey - spanning 6 to 12 months - so selecting the right attribution model is key. It helps you identify which campaigns are driving results and ensures you can report ROI effectively to leadership.
First-Touch vs. Last-Touch Attribution
First-touch attribution gives all the credit to the initial point of contact, such as a technical blog post or a native ad on platforms like daily.dev. While it highlights how developers first discover your product, it overlooks the critical evaluation phases that follow . On the other hand, last-touch attribution focuses on the final action before conversion, like clicking "Start Free Trial." While useful for identifying high-intent moments, it often ignores the earlier touchpoints - like documentation or community engagement - that build trust over time .
"Traditional MQL-based attribution would miss 80% of [the developer] journey." - Jono Bacon
Linear and Time-Decay Models
Linear attribution spreads credit equally across all interactions. While straightforward, this model treats all touchpoints the same - whether it's a quick documentation view or a full API integration. Time-decay attribution, however, gives more weight to recent interactions, such as a successful API integration, making it better suited for reflecting a developer's evolving decision-making process . For most developer campaigns, a 30-day time-decay model is often a solid choice .
For tools with longer sales cycles, a weighted multi-touch model can provide deeper insights. This approach assigns different credit percentages to each phase of the journey, such as Discovery (15%), Evaluation (25%), Trial (35%), Validation (20%), and Purchase (5%) . For example, when Postman adopted this model in March 2026, it improved their CAC accuracy by 40% by capturing technical touchpoints more effectively .
Attribution Model Comparison
Here’s a quick breakdown of how these models compare:
| Attribution Model | Best Use Case | Drawback for Developer Campaigns |
|---|---|---|
| First-Touch | Top-of-funnel awareness and brand lift | Misses evaluation and trial phases |
| Last-Touch | High-intent bottom-of-funnel actions | Overlooks documentation and community efforts |
| Time-Decay | Products with trial/integration-heavy phases | May undervalue the original discovery source |
| Weighted Multi-Touch | Complex tools with long sales cycles | Requires advanced data integration |
Bridging the Attribution Gap
Since 52% of developer tool discovery happens through untrackable "dark social" channels like Slack and Discord , software tracking alone won’t give you the full picture. To address this, incorporate self-reported attribution alongside your software tools. For example, adding an open-text question like "How did you hear about us?" during signup can capture insights that software might miss . This hybrid approach helps developer-focused companies better understand the impact of unmeasurable channels and improve their multi-touch attribution strategies .
Step 4: Measure the Dark Funnel and Platform-Specific ROI
Attribution models often miss key touchpoints in spaces like Slack and Discord, where much of developer discovery happens. To get an accurate picture of ROI, you’ll need to blend conventional analytics with strategies that capture these hard-to-track interactions.
Surveys and Self-Reported Attribution
Surveys are a great way to uncover hidden activity in the dark funnel. By directly asking developers how they discovered your tool, you can identify untracked sources like specific Slack workspaces, podcast episodes, or Twitter threads. Use an open-text box instead of dropdown menus for discovery questions to allow for more precise responses.
"The best attribution data often comes from a single form field. Add 'How did you hear about us?' as an open-text field on your demo request form."
– Alexander Chua, Co-Founder, Growigami
To ensure data accuracy, include a non-existent option to weed out unreliable responses. If respondents list multiple sources, follow up with a question like, "Which one had the biggest impact?" This is especially important since 67% of developers use ad blockers , meaning traditional tracking tools often miss key touchpoints. Beyond survey forms, community discussions can help validate your campaign’s impact.
Community Mentions as Engagement Signals
Software tracking tools often fall short when it comes to capturing dark funnel activity. That’s where community mentions come in as valuable proxy metrics. For instance, tracking brand search lift - an increase in branded Google searches - can signal growing awareness. A lift of over 20% indicates solid awareness, while a jump of more than 50% is exceptional .
You can also set up keyword alerts to monitor discussions about your product. Tools like TrackReddit can help you track mentions on Reddit’s technical subreddits . While these signals may not directly link to revenue, they provide insight into how your campaigns are influencing the broader conversation.
Platform-Specific ROI Tracking
To address gaps in traditional tracking, tailor your metrics to the platforms where developers engage. For example:
- Stack Overflow: Track metrics like question view counts and monthly mentions of your documentation URLs .
- Reddit: Use keyword alerts or tools like TrackReddit to monitor mentions of your tool in technical discussions .
- GitHub: Leverage GitHub Insights to track repository views, clone counts, and referrers. You can also scan dependency files or manifests to measure project adoption .
- daily.dev: Combine UTM tracking with self-reported attribution when you advertise with daily.dev. This way, you can capture both immediate clicks and delayed conversions from developers who may have seen your ad but visited your site later via direct search.
| Platform | Key Metric to Track | Recommended Method |
|---|---|---|
| Stack Overflow | Question views, URL mentions | Monthly tracking |
| Mentions in discussions | Keyword alerts, TrackReddit | |
| GitHub | Repo clones, dependency entries | GitHub Insights, SBOM scans |
| daily.dev | Click-through + attribution | UTM parameters + surveys |
Traditional attribution tools often miss offline and untrackable touchpoints like podcast mentions, Slack recommendations, or conference interactions . By combining platform-specific metrics with self-reported data, you can create a more complete picture of your ROI and better understand how developers engage with your campaigns.
Step 5: Report ROI to Leadership
Once you've gathered your full-funnel metrics and tackled the challenges of the dark funnel, it's time to present your findings to leadership. They don’t need to dive into the nitty-gritty of multi-touch attribution. Instead, they’re looking for a clear, high-level view of whether your campaigns are delivering results and how to allocate budgets effectively for the next quarter.
Build Dashboards for Developer Campaigns
Keep your dashboard focused on daily, actionable metrics that inform budget decisions. Include data from all stages of the funnel:
- Top-of-funnel: Impressions, CTR, CPM
- Mid-funnel: Signups, CPT (cost per trial), quickstart completions
- Bottom-of-funnel: Trial-to-paid conversions, ARR (annual recurring revenue)
"Only look at metrics that help you make decisions." – sderosiaux, Author of Developer Marketing Guides
To make these metrics meaningful for leadership, translate them into financial terms using conservative estimates. For example, if 1% of signups convert to $5,000 in annual revenue over two years, that’s $100 per signup . This approach provides a tangible ROI figure that leaders can use to compare performance across different channels. Tools like Google Analytics, Looker, or your CRM's reporting features can help you build these dashboards. Stick to metrics that directly impact decision-making - this clarity will make your updates more effective and your discussions with leadership more productive.
Set a Reporting Schedule
Developer sales cycles tend to be long, so it’s important to structure your reporting to balance short-term insights with long-term trends. Use a three-tiered schedule:
- Weekly: Monitor signup trends.
- Monthly: Review full-funnel performance.
- Quarterly: Assess program-level ROI in detail .
Quarterly reviews are particularly crucial for syncing with sales teams. During these reviews, walk through specific customer journeys, showcasing how each marketing touchpoint - ads, documentation visits, webinars - interacts with sales engagements. This collaborative approach helps reduce friction over attribution and fosters a shared understanding of how various channels contribute to overall success . Regular reporting, paired with clear dashboards, ensures everyone stays aligned on long-term goals.
Explain Metrics to Non-Technical Stakeholders
When presenting metrics to leadership, simplify the technical details and frame them in financial terms that resonate. Use relatable analogies to make complex concepts more approachable. For instance, explain that ROI is measured at the program or channel level, much like how product features work together to drive overall success. Highlight that multi-touch attribution acts as an "assist", boosting the performance of the entire system . For dark funnel metrics, describe them as "word of mouth", which explains why a significant portion of leads might not have a trackable source .
"Waste 50% of your budget to get more value from the other 50%... Accept that not everything is measurable." – Rand Fishkin, Founder of SparkToro
Be upfront about data gaps, such as those caused by ad blockers. With 67% of developers using ad-blockers , traditional attribution methods will always have limitations. To address this, combine standard attribution data with self-reported insights to give leadership a broader view. When discussing conversion rates, provide context: a trial-to-paid conversion rate above 15% is solid, while anything over 25% is exceptional. Similarly, aim for a cost per trial under $30 for good performance, or under $15 for excellent results .
Conclusion
Measuring ROI for developer ad campaigns requires a unique approach compared to traditional B2B marketing. One major challenge is that about 67% of developers use ad-blockers, making it impossible to rely only on software-based tracking tools. To get a full picture, combine these tools with self-reported surveys to capture all interactions, including those hard-to-track "dark funnel" signals from platforms like Slack, podcasts, and word-of-mouth.
To navigate these tracking hurdles, a clear framework can help. Start by implementing proper tracking with UTM conventions and CRM integration. Monitor the entire funnel, from impressions to paid conversions. Choose an attribution model that aligns with your sales cycle, and use self-reported data to focus on program-level ROI rather than obsessing over every individual touchpoint.
Given these complexities, your reporting should emphasize what truly drives growth. Accept that some interactions will remain unmeasurable and instead track activation metrics like "Time to First Hello World" as proxies for long-term value. Use a tiered reporting system: weekly updates for signup trends, monthly reviews of full-funnel performance, and quarterly deep dives into pipeline metrics alongside sales teams. This approach helps avoid over-optimizing irrelevant metrics and keeps your focus on meaningful growth drivers.
Finally, transparent reporting is key to building trust and securing your marketing budget. By linking accurate attribution with dollar-value estimations, you can demonstrate the impact of your efforts. For instance, showing that each signup is worth around $100 - based on a 1% conversion rate of a $5,000 annual contract over two years - provides clarity. Combine this with consistent reporting and open discussions about data limitations to build confidence and secure the resources needed to scale your developer marketing initiatives.
FAQs
Which activation event should I use as the main ROI proxy?
When evaluating ROI, the primary event to focus on is often product activation or sign-up completion. These milestones demonstrate developer engagement and signal technical adoption. Other events, such as SDK implementation, feature activation, or onboarding completion, also serve as strong indicators. They highlight key developer actions that are likely to drive long-term value.
How do I estimate ROI when most conversions show up as direct traffic?
Direct traffic often includes users whose original source can't be tracked accurately. To better estimate ROI, combine different attribution methods, such as self-reported attribution and software-based tracking tools. Using consistent UTM parameters and setting up proper conversion tracking can also improve data accuracy.
For those harder-to-track conversions, consider tools like surveys or monitoring community mentions to shed light on "dark funnel" activity - where users engage with your brand in ways that aren't easily measurable. However, it's important to accept that some conversions will always remain categorized as direct. Instead of focusing solely on these gaps, evaluate the bigger picture by analyzing overall campaign performance and using multi-touch attribution to refine your ROI estimates.
What attribution model works best for a 6–12 month developer journey?
For a developer journey spanning 6 to 12 months, multi-touch attribution models like linear or time-decay are typically the most effective. Here's why:
- Linear attribution spreads credit evenly across all touchpoints, making it a solid choice for longer journeys with multiple interactions.
- Time-decay attribution gives more weight to recent interactions, which can better represent the intent behind a conversion.
However, these models might miss less tangible influences, like word-of-mouth recommendations. To address this, you can pair them with self-reported attribution methods - for example, surveys that ask developers how they first heard about your product. This combination can provide a fuller picture of your product's discovery path.