
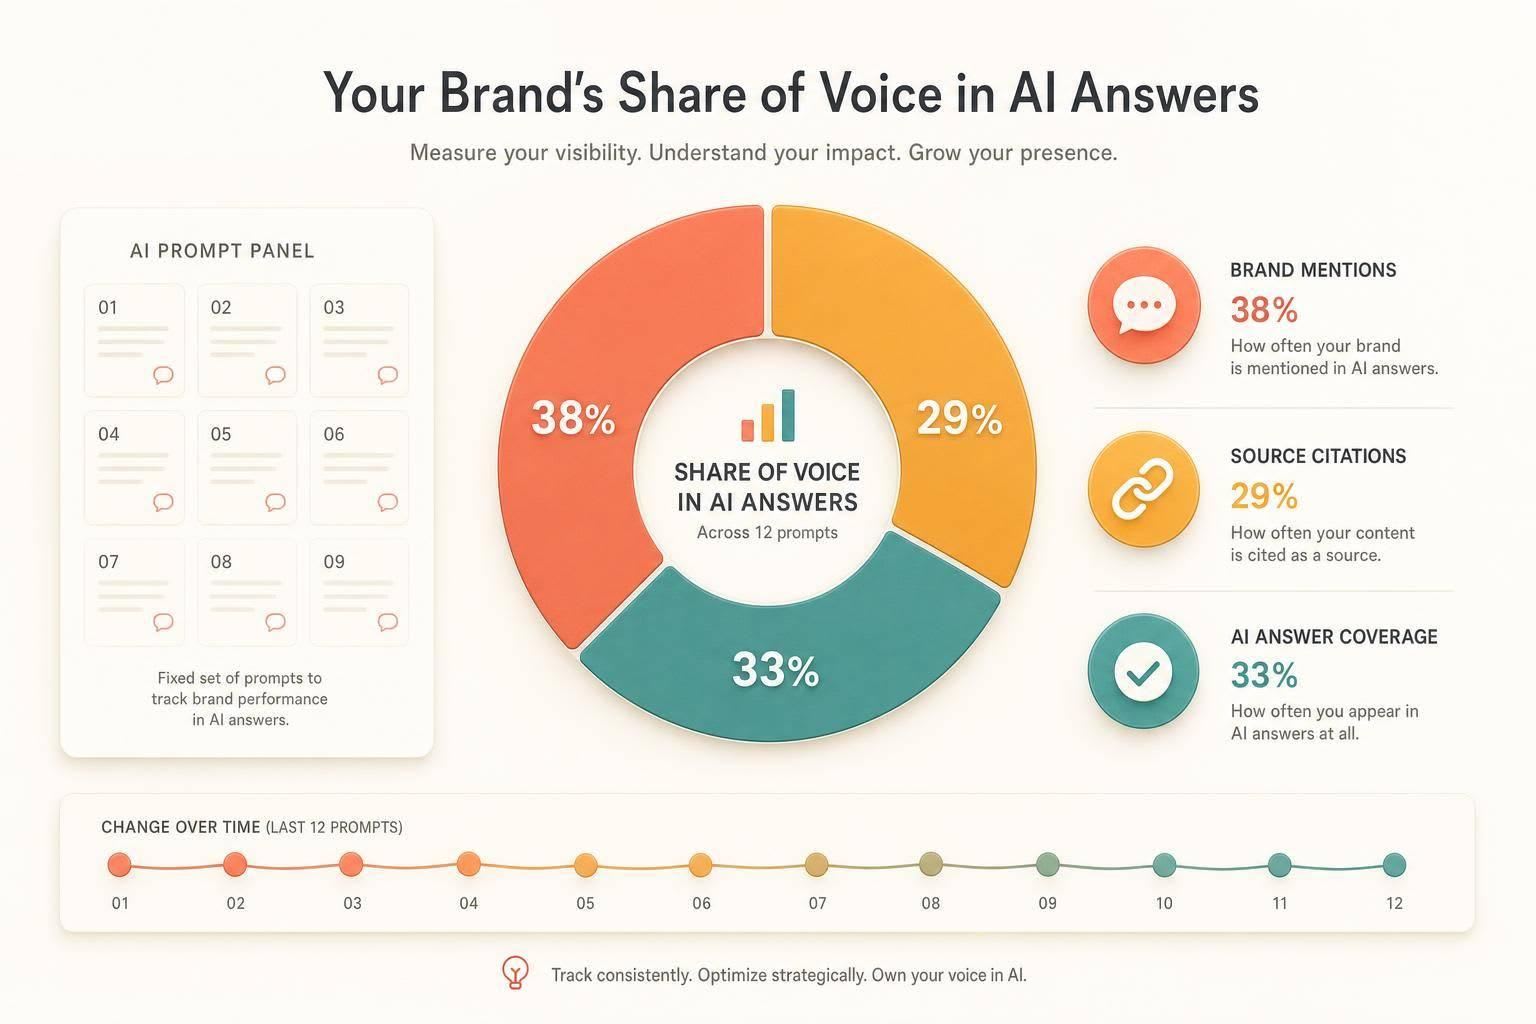
AI answers are now part of demand gen. When AI Overview coverage for B2B tech queries jumps from 36% to 82% in one year, I can’t treat AI visibility like a side metric anymore.
Here’s the short version: I’d measure AI share of voice by tracking how often my brand gets mentioned, how often my owned content gets cited, and how often AI answers appear at all for a fixed set of prompts. Then I’d review those numbers by platform, topic, and time period so I can see what changed and why.
If I wanted a simple framework, I’d use this:
- Build one fixed prompt set and reuse it each month
- Split mention rate from citation rate
- Group prompts by buyer intent: category, use case, comparison, constraint, and brand
- Track each AI platform on its own before rolling numbers up
- Weight results by platform importance and topic intent
- Review trends weekly, monthly, and quarterly
- Compare AI visibility with campaign data to separate media impact from model shifts
A few points matter most:
- A mention means the AI names my brand
- A citation means the AI uses my site, docs, blog, or repo as a source
- Those two numbers can move in different directions
- If citations go up but mentions do not, my content may be influencing answers without giving my brand credit
Here’s a quick view of the core measurement setup:
| Metric | What I’d track | What it tells me |
|---|---|---|
| Mention rate | % of AI answers that name my brand | Brand presence in answers |
| Citation rate | % of AI answers that cite my owned sources | Source visibility |
| Answer coverage | How often AI answers appear for my prompt set | How much AI is shaping discovery |
| Weighted SOV | SOV adjusted by platform and topic weights | A rolled-up view I can report |
I’d also keep the math simple:
- AI Mention SOV (%) = (my brand mentions ÷ total category mentions) × 100
- AI Citation SOV (%) = (my brand citations ÷ total category citations) × 100
Bottom line: if I want to know whether my AEO or GEO work is paying off, I need a fixed prompt panel, clean scoring, and a repeatable reporting cadence. That turns AI visibility from guesswork into something I can track over time.
How to build a prompt set you can measure over time
Set up one fixed prompt panel and run it again every month. That way, changes show model behavior, not wording drift. It’s the same measurement discipline we use internally. Use this panel to track both mention rate and citation rate over time.
Map prompts to developer jobs to be done
Start with what developers are trying to get done, not with your product feature list. Think in terms of jobs like observability, CI/CD, API testing, authentication, and infrastructure tooling. That gives you a clean way to group prompts.
Where should the wording come from? Go straight to the places where developers talk like developers:
- Sales call notes
- Reddit and Hacker News threads
- Internal search logs
Use the language people use when they’re trying to fix a problem, not the wording from your homepage or product docs.
Group your prompts into five cohorts, each with its own measurement goal:
| Prompt Cohort | Example Query | Measurement Goal |
|---|---|---|
| Category | "Top observability tools for Node.js" | Baseline category visibility |
| Use case | "What should a TypeScript team use for serverless Postgres?" | Use case visibility |
| Comparison | "Neon vs Supabase for a Next.js app" | Competitive positioning in AI answers |
| Constraint | "Which auth tools have a usable free tier for a two-person startup?" | Visibility for specific buyer segments |
| Brand | "Does [Product] support private networking?" | Accuracy of product facts in AI models |
This split helps you keep broad discovery prompts apart from product-checking prompts. Hold off on brand prompts until your category and use case cohorts are stable.
Prompt design rules for clean benchmarking
Wording consistency matters a lot. If you rewrite a prompt between runs, you won’t know whether the result changed because the model changed or because you changed the input. Keep the core prompt set the same across runs.
Add stack-specific phrasing where it matters. Terms like “for React Native” or “in Python” match how developers ask for help in the wild .
"A single blended visibility percentage can hide the fact that a product is visible for broad category prompts but absent from the framework-specific prompts that actually drive adoption." - Ben Williams, CEO, DevTune
Version your prompts with care. A practical rule is to rotate no more than 10–15% of the set each quarter . That keeps your trend lines usable and makes spikes or drops a lot easier to explain.
Separate platforms, locales, and prompt cohorts before rolling up results
Run the same core prompt set across each major AI assistant. Keep platform results and locale results separate at first. Only roll them up later into a weighted score.
Why? Because each platform has its own knowledge base and its own citation habits. So the outputs will differ.
Once the panel is fixed, the next step is picking tools that can record these signals the same way every time.
How to choose the right tools for measuring AI visibility
Use tools that run the same fixed prompt panel every time and log the same outputs on each pass. That’s how you see whether your brand was mentioned, whether your docs were cited, and how those signals move over time. If the collection process changes from run to run, you’re not measuring much. You’re just spot-checking.
Track mentions, citations, and answer coverage with AI visibility tools
Track three outputs on their own: mentions, citations, and answer coverage. Most teams begin with mentions, then add the other two after their prompt panel settles down.
For most dev-tool marketing teams, two tool types do most of the job. End-to-end AI marketing agents like Gauge run your prompt set across many AI engines, log both mentions and citations, and show trend lines by platform. SEO bolt-on tools like Ahrefs Brand Radar live inside current SEO dashboards and give you basic mention tracking. Pick tools based on the assistants your audience uses most.
Here’s the catch: a model can use your documentation as a source and still never say your brand name in the answer. That’s why you need to track mention rate and citation rate as separate signals. It’s the only clean way to catch the citation-without-mention gap.
Tool categories mapped to metrics: a comparison table
| Tool Category | Example | What It Tracks | When to Use It |
|---|---|---|---|
| End-to-End AI Marketing Agents | Gauge | Mentions, citations, answer coverage | Closing visibility gaps across multiple AI platforms |
| Enterprise Analytics | Profound | AI SOV at scale, large prompt databases | Large teams with compliance-heavy procurement |
| SEO Bolt-ons | Ahrefs Brand Radar | Brand mentions | Brand monitoring within existing SEO workflows |
| SMB Monitoring | Otterly AI | Basic mentions | Low-cost first step for small teams |
Choose based on the signals that matter most to you: mentions, citations, and platform coverage.
Connect AI visibility measurement to daily.dev Ads campaign analysis
AI visibility tools show what’s happening inside AI answers. daily.dev Ads campaign data shows what’s happening with the developer audience you’re paying to reach. Put those together, and you can separate campaign impact from model behavior.
The workflow is pretty simple. Run a daily.dev Ads campaign aimed at developers by stack or seniority. Then watch your AI visibility dashboard over the next few weeks to see whether mention rate or citation rate moves for the prompt cohorts tied to that audience. Treat campaign traffic and AI visibility as two different signals, then read them side by side.
You don’t need one all-in-one dashboard for this. A simple side-by-side review works fine: campaign impressions on one side, mention rate and citation rate on the other. That’s often enough to tell whether your brand signal is building or stalling.
How to calculate AI share of voice from your data
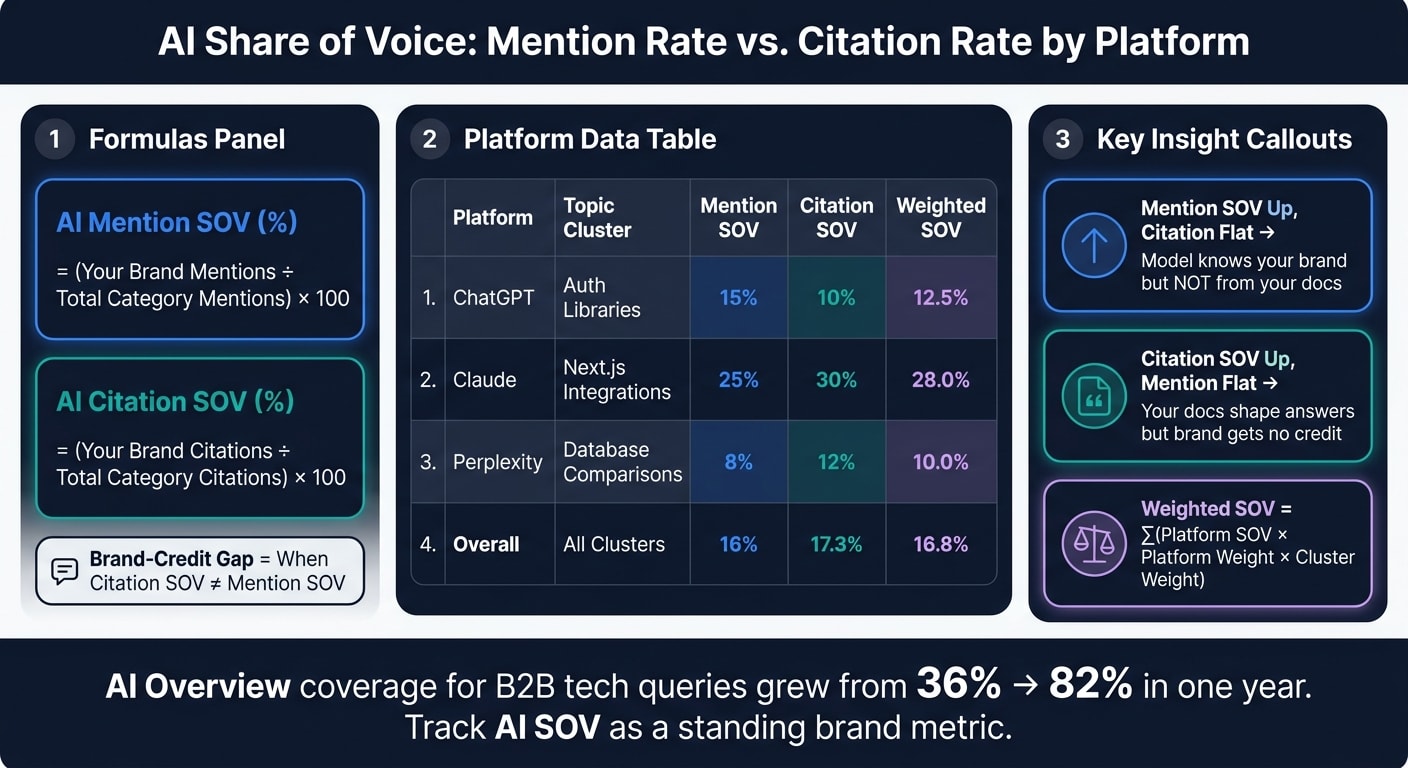
Once your fixed prompt panel is logged, turn the counts into two KPIs.
Calculate mention share and citation share separately
Use these formulas in every reporting cycle:
- AI Mention SOV (%) = (your brand mentions ÷ total category mentions) × 100
- AI Citation SOV (%) = (your brand citations ÷ total category citations) × 100
These two numbers are not always the same. A model can cite your docs without naming your brand. When that happens, citation SOV and mention SOV split apart. That difference is the brand-credit gap.
Weight results by platform and topic cluster
Don’t treat every platform the same. Weight each one based on audience importance and answer quality, and use the same prompt panel every time so results stay comparable.
Weighted SOV = Σ(platform SOV × platform weight × cluster weight)
Use the same approach for topic clusters. Comparison prompts ("X vs. Y") and constraint prompts ("best tool for [specific framework]") tend to show higher-intent evaluation moments, so they should carry more weight than broad category queries .
Also, keep cluster-level reporting visible. A single rolled-up number can hide where you’re winning and where you’re barely showing up.
Reporting table: raw counts and percentages side by side
Show raw counts next to percentages. Percentages by themselves can hide volume. Raw counts by themselves can hide relative position. And if you want clean trend lines, use the same weights in every reporting cycle so the roll-up stays comparable .
| Platform | Topic Cluster | Mentions | Citations | Mention SOV | Citation SOV | Weighted SOV |
|---|---|---|---|---|---|---|
| ChatGPT | Auth Libraries | 45 | 30 | 15% | 10% | 12.5% |
| Claude | Next.js Integrations | 20 | 25 | 25% | 30% | 28.0% |
| Perplexity | Database Comparisons | 12 | 15 | 8% | 12% | 10.0% |
| Overall | All Clusters | 77 | 70 | 16% | 17.3% | 16.8% |
Keep raw counts beside percentages so leadership can audit the roll-up. Keep these raw and weighted figures for the reporting cadence section that follows.
How to set a reporting cadence and read the trends correctly
Pick a cadence based on how fast your category moves
Once you’ve standardized the report, cadence shapes how you read movement over time. What matters most is consistency, not how often you check. Fixed prompts and fixed scoring rules keep trend lines comparable. If you change either one in the middle of a cycle, the numbers get muddy fast.
For most dev-tool teams, this three-tier setup works well:
| Cadence | Focus | Key Metrics to Review |
|---|---|---|
| Weekly | Tactical scoreboard | Mention share, citation share, answer coverage |
| Monthly | Content effectiveness | Citation vs. mention gap, URL-level citations, source mix |
| Quarterly | Strategic benchmarking | Re-check the same weekly and monthly metrics over a longer window |
Fast-moving categories usually need weekly checks so teams can spot shifts early. More stable categories can often work with monthly reviews, then use quarterly check-ins to look at the longer arc.
How to interpret changes in mentions and citations
Once the review window is set, focus on changes that show up across platforms, not random spikes. Start by checking whether the move appears in more than one platform. Then line it up against launches, documentation updates, and campaigns from that same period. If the drop happens on just one model, that often points to a model-specific update. If it shows up across platforms, that’s the signal to pay attention to.
One pattern deserves close attention: mention share goes up, but citation share stays flat. That usually means the model knows your brand, but not from your own docs. Your content may be shaping the answer, yet your brand gets no credit.
The reverse matters too. If citation share climbs while mention share stays flat, your docs are likely helping build the answer, but the model still isn’t naming your brand in the generated text.
Conclusion: treat AI SOV as a standing brand metric
The goal isn’t just to make a report. It’s to build a measurement habit you can repeat. AI share of voice is not a one-time audit. The full measurement loop only pays off when teams keep running it.
AI Overview coverage for B2B technology queries increased from 36% to 82% in a single year . That pace does not slow down. Teams that treat AI SOV as a standing brand metric are far more likely to catch changes early instead of finding them months later.
FAQs
what is AEO/GEO?
AEO stands for Answer Engine Optimization, and GEO stands for Generative Engine Optimization. They started as separate terms, but these days they mostly point to the same kind of work.
Both are about structuring technical content so AI systems can find it, understand it, and cite your brand or documentation in generated answers.
How many prompts should I include?
For a reliable baseline, start with at least 20 prompts across major platforms. If you're running a weekly audit, 10 to 15 category-specific queries are usually enough.
Build your prompt set around five groups:
- Category prompts
- Use-case prompts
- Comparison prompts
- Constraint prompts
- Brand prompts
Keep those prompts unchanged for a set period. That way, you can tell whether shifts in responses come from content updates or from changes to the prompts themselves.
How long until AI SOV trends mean something?
AI SOV trends start to mean something once you’ve tracked the same prompt set long enough for the numbers to settle. For GEO and citation-style visibility, that usually takes about 2–8 weeks. Broader SEO-style effects tend to take longer and can take months.
The big mistake is calling it too early. A small bump one week doesn’t mean much on its own.
Instead, track these two numbers every week:
- Mention rate
- Citation rate
It also helps to re-run your baseline prompts on a fixed schedule. A simple setup is a 30-day plan with a Week 1 baseline and a Week 4 comparison.