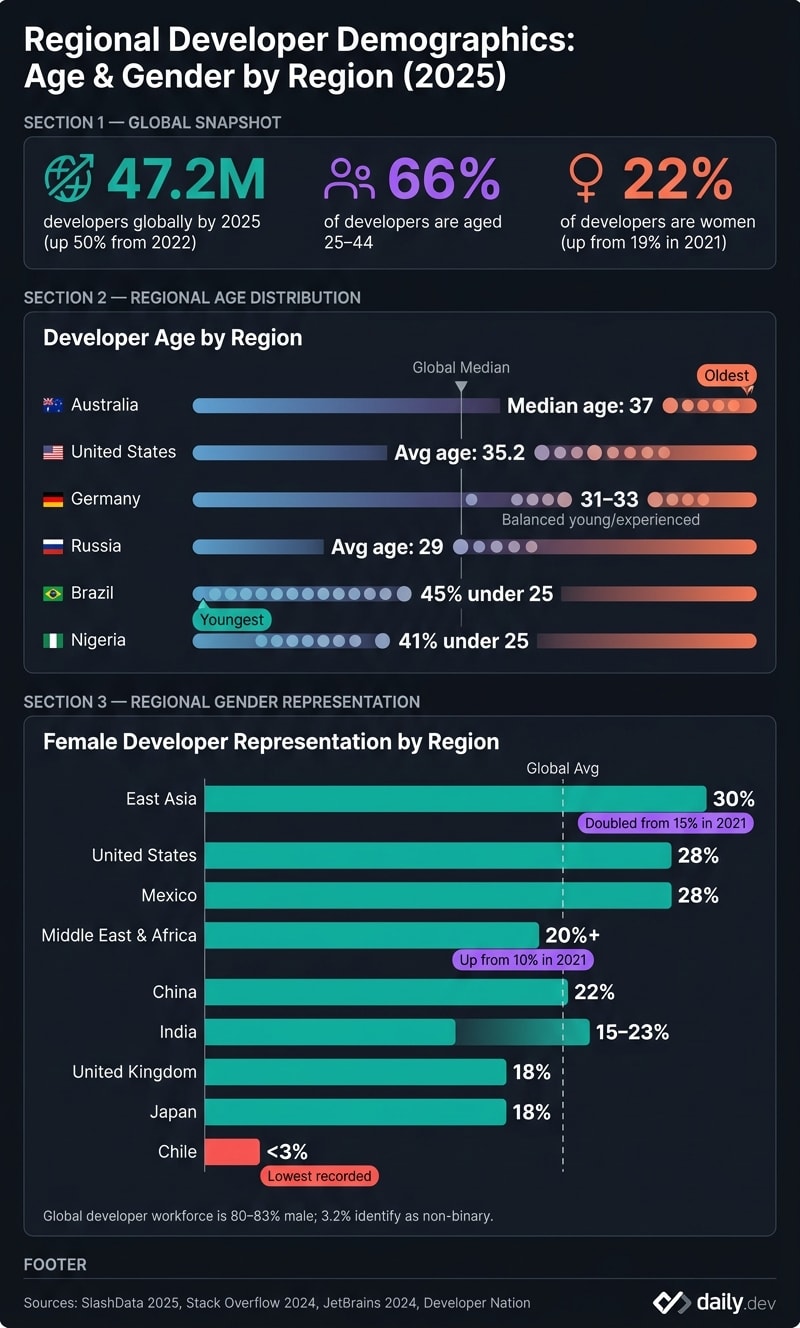
The global developer workforce reached 47.2 million by 2025, up 50% from 2022. However, regional differences in age and gender highlight unique trends:
Age Trends:
- Developers aged 18–24 dropped from 33% in 2022 to 23% in 2025.
- The 25–44 age group now makes up 66% of the workforce.
- Regional differences: The U.S. has an average developer age of 35.2 years, while 45% of Brazilian developers are under 25.
Gender Trends:
- Globally, 80–83% of developers are male; women make up 22%, with 3.2% identifying as non-binary.
- Women between 25–34 account for 25% of developers in that age group.
- Regional highlights: Female representation is 28% in the U.S. and Mexico but under 3% in Chile. East Asia saw a rise from 15% to 30% between 2021 and 2023.
These shifts reflect the aging workforce, growing professionalism, and gradual improvements in gender diversity. Tailored strategies are essential for engaging developers across regions and demographics.
Global Age and Gender Overview
Building on our introduction to developer demographics, this section dives into global trends in age and gender among developers.
Global Age Distribution
The developer workforce is evolving as professionals age and gain experience. In 2022, developers aged 18–24 made up about 33% of the global population. By early 2025, this figure dropped to 23% . Meanwhile, the 35–44 age group increased from 22% to 26% during the same period .
Currently, the median age of developers is 30, with the 25–44 age bracket accounting for roughly 66% of the workforce . However, only 12% of professional developers have over 20 years of experience .
These shifts in age distribution are mirrored by changes in gender representation, adding another layer to the demographic picture.
Global Gender Distribution
Men dominate the global developer workforce, comprising approximately 80% to 83% of professionals, depending on the data source . Female representation has seen a modest increase, rising from 19% in 2021 to 22% in 2023 . Additionally, around 3.2% of developers identify as non-binary .
Breaking it down further, women represent 25% of developers in the 25–34 age group, the highest proportion among all age brackets. This suggests that gender diversity is gradually improving among newer entrants to the field . Representation also varies by technical domain: women make up 33% of developers in VR but only 13% in backend services .
Data Limitations and Variability
It's important to recognize the limitations of these global statistics. Definitions of "developer" differ across research organizations, leading to varying totals. For example, SlashData projects 47.2 million developers worldwide by 2025 , while JetBrains estimates 19.6 million professional developers in 2024, after including QA analysts and data scientists in their model .
Survey participation also affects the data. In the Stack Overflow 2024 Developer Survey, only 52% of respondents disclosed their geographic location . Additionally, the top 10 responding countries accounted for 60% of all location data, with Europe and North America being heavily represented . Regions like Africa and parts of Southeast Asia are underrepresented, meaning global averages may not fully capture the diversity of the developer community worldwide.
These insights provide a foundation for exploring how developer demographics vary by region.
Developer Age Distribution by Region
Regional Trends in Developer Age
The age of developers varies significantly depending on their geographic location. While the global median developer age is 30, this figure hides notable differences across regions . Let’s dive into how these trends play out.
Established tech hubs tend to have older developers. For example, the United States reports an average developer age of 35.2 years, while Australia’s median age is even higher at 37. These regions, with their mature tech ecosystems, often support longer careers in development, contributing to a higher average age .
Emerging markets tell a different story. In Brazil, 45% of developers are under 25, and in Nigeria, that figure is 41% . These regions are experiencing rapid digital growth, which often attracts younger, self-taught individuals into the tech workforce. For instance, Latin America’s developer population has grown by 15.6% since 2021, and India’s tech workforce is expanding at a rate of 14% annually, largely driven by younger talent .
The role of government initiatives and industry maturity is crucial. In Greater China, government-led education programs have tripled the number of developers to 5.8 million since 2022 . Meanwhile, Russia occupies a middle ground, with an average developer age of 29 - older than emerging markets like Nigeria but younger than Western countries .
Germany offers a unique case. While 35% of developers in the country are under 30, only 7.5% of developers across Europe are over 50 . This indicates a relatively even distribution of young and experienced developers in Western Europe, unlike the youth-heavy demographics seen in Africa or Latin America.
Regional Age Comparison Table
| Region | Median/Avg Age | Dominant Age Group | Skew vs. Global Average |
|---|---|---|---|
| Global | 30 (median) / 33 (avg) | 25–34 (28.8%) | - |
| Australia | 37 (median) | 35+ | Older |
| United States | 35.2 (avg) | 25–44 | Older |
| Germany | ~31–33 | Under 30 (35%) | Balanced |
| Russia | 29 (avg) | Under 30 | Younger |
| Brazil | Under 25 | Under 25 (45%) | Younger |
| Nigeria | Under 25 | Under 25 (41%) | Younger |
Developer Gender Distribution by Region
Gender Representation by Region
After exploring age distributions across regions, let’s shift focus to gender representation. When we examine how gender representation varies regionally, some patterns stand out that differ significantly from global norms.
In the United States and Mexico, women make up approximately 28% of the developer workforce . However, Chile reports a strikingly low figure, with female representation falling below 3%, the lowest noted in major studies . Meanwhile, East Asia has seen a remarkable rise, with female representation nearly doubling from 15% in 2021 to close to 30% by 2023 . A similar upward trend is observed in the Middle East and Africa, where the percentage of female developers grew from 10% to over 20% during the same period .
"The gender split in the developer community continues to highlight a significant under-representation of female coders." - Developer Nation
Interestingly, women between the ages of 25–34 represent 25% of developers in that age group, the highest proportion across all age brackets . This suggests that younger generations are gradually contributing to a more gender-diverse workforce, hinting at regional progress over time.
These regional differences call for a closer look at the factors driving these disparities.
Factors Behind Gender Gaps
In Europe, nearly 44% of women in tech come from non-STEM educational backgrounds, compared to 26% of men . This disparity limits their access to roles in areas like backend development or cybersecurity. Cultural influences also play a significant part - 7% of European women leave the tech field due to caregiving responsibilities, whereas this figure is just 0.5% for men . Additionally, 70% of women in tech report feeling they need to work harder to prove their competence because of their gender .
On the other hand:
"India's education and tech industry culture is more conducive to gender equality in computer programming." - HackerRank
Women are better represented in emerging fields like Virtual Reality (33%) and Augmented Reality (28%), but their presence in backend services (13%) and security remains minimal . A persistent 10-percentage-point gap in formal computer science degree attainment between men and women further contributes to the lower numbers of women in these backend-focused roles . Addressing these structural and cultural challenges is key to creating strategies that effectively engage women developers across different regions. Companies looking to reach these specific groups can target developers by geography and other demographics to support diversity initiatives.
Regional Gender Comparison Table
| Region | Female Representation | Notable Trend |
|---|---|---|
| United States | 28% | High overall share; drops to 14.8% on competitive coding platforms |
| Mexico | 28% | Among the strongest in Latin America |
| East Asia | ~30% | Doubled from 15% between 2021 and 2023 |
| India | 15%–23% | Culture highly supportive of female STEM participation |
| China | 22% | Female developers rank highest in algorithm challenge scores |
| Middle East & Africa | 20%+ | Grew from 10% in 2021 |
| United Kingdom | 18% | Steady, consistent representation |
| Japan | 18% | Workforce remains 82% male |
| Chile | <3% | Lowest recorded representation in major studies |
Using Demographics to Guide Developer Outreach
Understanding regional demographic trends can help craft more focused and effective outreach strategies.
Adjusting Campaigns to Match Regional Demographics
Regional data sheds light on when developers are most engaged. For example, developers in North America are most active between 11 AM and 2 PM ET, while European developers engage more consistently throughout the day, from 10 AM to 6 PM CET . Tailoring content to developers' career stages also enhances relevance - beginner developers benefit from tutorials, mid-level professionals prefer technical content, and senior developers respond well to enterprise-focused messaging.
These insights are invaluable for creating targeted campaigns through daily.dev Ads.
Using daily.dev Ads for Targeted Campaigns
Timing and relevancy are key to effective advertising, especially when over 67% of developers use ad-blockers . Traditional display ads often fall short, but daily.dev Ads takes a different approach. By integrating ads directly into the content feed, the platform ensures ads appear as sponsored cards during moments when developers are actively discovering new tools and solutions . These native placements rely on real-time user behavior within the platform, aligning ads with the content developers are already engaging with.
"Developers do not click on ads. They click on solutions to their problems." - daily.dev
With a global audience breakdown of 40% in Europe (EMEA), 35% in North America, 15% in Asia Pacific, and 10% in Latin America, daily.dev Ads allows advertisers to target campaigns with precision. Additionally, the platform's audience spans various experience levels: 25% junior, 45% mid-level, and 30% senior developers .
Recommendations for Reaching Developers Effectively
To maximize outreach, consider these actionable strategies:
- Focus on desktop placements: Developers often evaluate APIs and tools on desktop devices, making this an ideal channel for high-intent actions .
- Align content with career stages: Use beginner tutorials and free-tier offers for junior developers, detailed technical specs for mid-level professionals, and enterprise-focused material for senior-level audiences.
- Experiment with creative variations: Test 10–15 different creative formats to identify the most effective combinations and allocate budgets accordingly .
With AI and machine learning emerging as the fastest-growing skill set on the platform - marked by a 156% increase in engagement - campaigns that emphasize these areas are likely to perform well.
Conclusion
Emerging markets, like Brazil, stand out for their youthful developer population - over 40% are under 25 years old. In contrast, more established regions such as Australia and the United States report median developer ages of 37 and 35.2, respectively. These differences highlight the importance of tailoring outreach strategies to meet the specific needs of each region.
Key Takeaways
The data provides some clear insights: globally, 66% of developers fall within the 25–44 age range, making them the primary demographic to target. However, regional variations are crucial. For instance, in markets like Brazil and Nigeria, where over 40% of developers are under 25, early-career-focused messaging resonates more than content aimed at enterprise-level professionals.
Female representation in the developer community is also evolving. In East Asia, participation nearly doubled, climbing from 15% to 30%. Similarly, the Middle East and Africa saw an increase from 10% to over 20%. These changes signal opportunities to engage audiences in regions that have historically been underrepresented.
"The developer community remains predominantly male... more initiatives are needed to increase female representation and inclusion of other gender identities in the developer space." - Developer Nation Report
To boost the effectiveness of campaigns, consider localizing ad copy by experience level, aligning messaging with regional preferences for tools, and focusing on niche areas. For example, virtual reality projects show female participation rates as high as 33%. Platforms like daily.dev Ads offer tools to fine-tune targeting, ensuring content resonates with specific regional and demographic needs.
FAQs
Why is the share of developers ages 18–24 shrinking worldwide?
The number of developers aged 18–24 is shrinking as the global developer workforce gets older and more established. Fewer young individuals are joining the industry, while seasoned developers are sticking around longer. As a result, the workforce is becoming more experienced, with a stronger emphasis on long-term careers and stability, especially among those in the 25–44 age group.
What explains big age differences between regions like the U.S. and Brazil?
Age differences among developers in places like the U.S. and Brazil highlight contrasts in demographics and market development. In the U.S., developers tend to be older, with an average age ranging from 35.2 to 39 years. Meanwhile, in Brazil, nearly 45% of developers are under 25. This difference illustrates how newer tech hubs often draw in younger talent, while more established regions like North America see a larger proportion of seasoned professionals.
What can teams do to improve gender diversity in developer hiring and outreach?
Boosting gender diversity requires intentional structural adjustments. Start by removing gender-coded language from job descriptions. This ensures roles appeal to a broader audience and don’t unintentionally discourage applicants. Additionally, standardized interviews can help reduce unconscious bias during the hiring process, while diverse interview panels bring varied perspectives to candidate evaluations.
To retain talent, consider implementing flexible work policies that accommodate different needs. Regular pay equity audits are essential to identify and address any disparities. Clear and transparent promotion criteria also foster trust and fairness, showing employees a clear path to advancement.
Mentorship programs can play a key role in supporting underrepresented groups, offering guidance and career development opportunities. Outreach efforts, such as STEM initiatives, can encourage more diverse participation in technical fields. For targeted outreach, platforms like daily.dev Ads allow you to connect with developers worldwide, tailoring campaigns based on interests and seniority levels. These strategies collectively create a more inclusive and equitable workplace.