

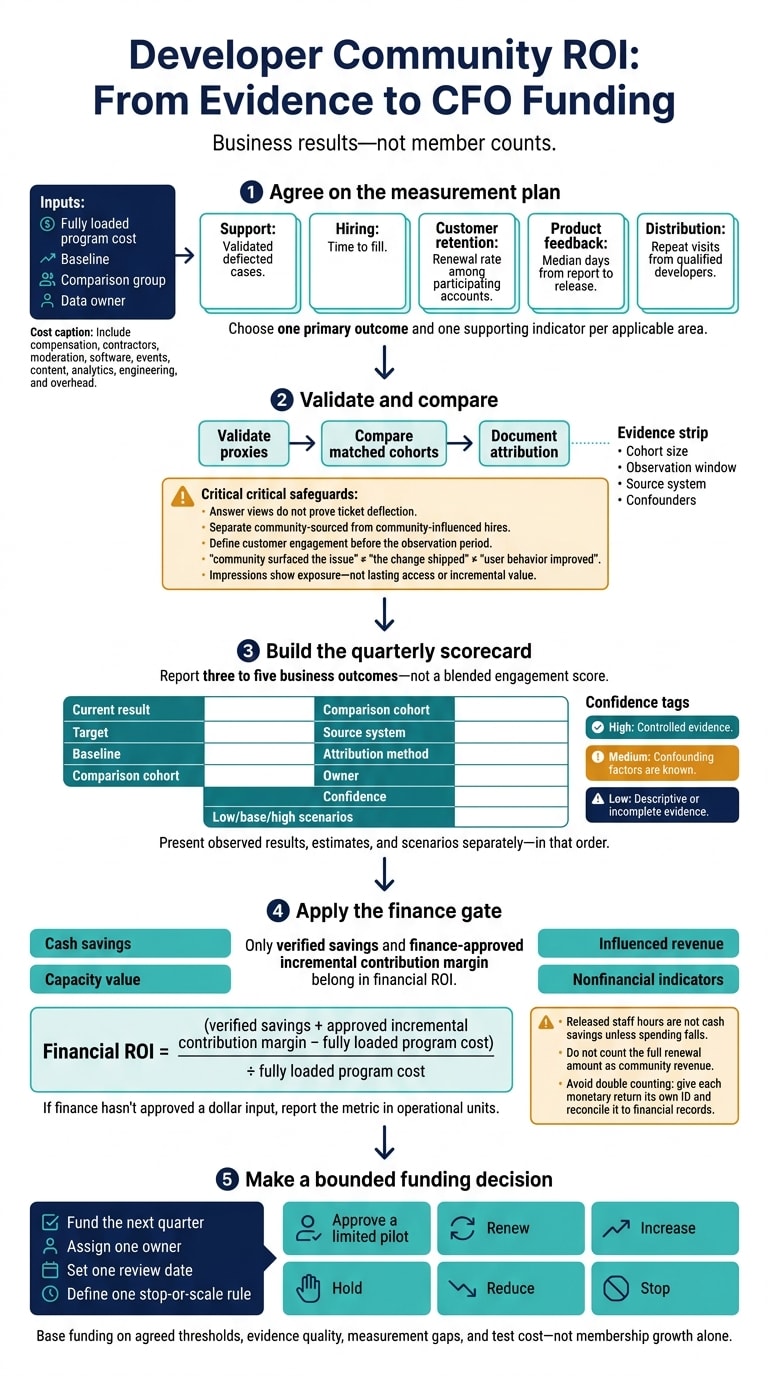
I make the case for community funding with business results - not member counts. Before asking your CFO for next quarter’s budget, I’d agree on costs, a baseline, and a comparison group across 5 areas:
- Support: Did peer answers reduce tickets without hurting service?
- Hiring: Did community contacts help fill roles and retain hires?
- Customer retention: Did participating accounts adopt, renew, or expand more?
- Product feedback: Did reports help teams fix problems and ship changes sooner?
- Distribution: Did community channels bring qualified developers back?
I’d keep cash savings, freed staff time, and influenced revenue separate. Only verified savings and finance-approved incremental contribution margin belong in financial ROI.
Then I’d put the results, costs, and uncertainty in one quarterly scorecard - and request a bounded test with an owner, review date, and stop-or-scale rule.
2. Measure support, hiring, and customer retention
Support capacity, hiring efficiency, and retained revenue give CFOs ways to assess community results. Apply the same test to each: validate the proxy, compare matched cohorts, and translate the findings into a metric that finance owns.
Estimate support deflection
An answer view does not prove that a ticket was avoided or staff capacity was freed. Validate deflection through user confirmation, linked ticket records, or matched cohorts. Then check whether the same issue turns into a ticket later.
Track tickets per active account alongside peer-answer rate, accepted-answer rate, median resolution time, repeat questions, and escalations. Watch unresolved questions, reopened cases, and customer satisfaction, too. Otherwise, apparent deflection could mask poor service.
Estimated support capacity released = validated deflected interactions × fully loaded cost per interaction. Use low, base, and high estimates to account for uncertainty in deflection, handling time, channel, and case complexity.
Report absorbed demand or released staff hours separately from verified expense reductions. Handling more demand with the same staff adds capacity - it does not mean payroll savings. Finance should confirm any reduction in contractor spending, payroll, or planned hiring needs.
Apply the same evidence standard to recruiting: keep the first source separate from later influence.
Track community contributions to hiring
To assess cost per hire and time to fill, record first source and later community influence separately in the applicant-tracking system (ATS). Use distinct labels for community-sourced, community-influenced, employee-referred, recruiter-sourced, inbound, and unknown candidates.
Track candidates from qualified application through interview, offer, hire, ramp, and retention. Compare community-attributed candidates with people hired for similar roles during the same period. Include community program costs and recruiter time in recruiting cost per hire.
| Indicator | CFO interpretation | Confounders to check |
|---|---|---|
| Qualified community-sourced applicants and referrals | Talent pipeline strength measured by qualified applicants per open role | Role scarcity, seniority, geography, employer brand |
| Qualified-applicant-to-interview conversion | Candidate fit and prequalification | Screening standards, role requirements |
| Offer acceptance | Ability to convert candidates into hires | Compensation, location, competing offers, timing |
| Time to fill | Vacancy duration | Role difficulty, approval delays, hiring-manager responsiveness |
| Recruiting cost per hire | Channel efficiency | Event costs, recruiter labor, referral bonuses, attribution rules |
| Ramp time | Speed to productive contribution | Prior experience, onboarding, role complexity |
| Six- and twelve-month employee retention | Durability of hiring outcomes | Manager, compensation, labor-market conditions |
Use the same cohort approach for customers. Compare engaged and non-engaged accounts before claiming that community activity affects retention.
Compare customer adoption and retention
To assess renewal durability and expansion, define engagement before the observation period. Engagement could mean asking a question, accepting an answer, or attending an event.
| Metric | Engaged cohort | Non-engaged cohort | CFO interpretation | Key confounders |
|---|---|---|---|---|
| Activation | Activation rate | Activation rate | Reaching initial product value | Onboarding path, plan, prior product knowledge |
| Feature adoption | Adoption rate by feature | Adoption rate by feature | Broader product use | Account size, use case, release timing |
| 30-, 60-, and 90-day retention | Retained share at each interval | Retained share at each interval | Durability of product value | Tenure, implementation status, customer segment |
| Renewal | Renewal rate | Renewal rate | Recurring revenue durability | Contract length, price, sales segment, product fit |
| Expansion | Expansion rate or amount | Expansion rate or amount | Account growth | Account size, sales coverage, budget, usage intensity |
| Support dependency | Tickets per active account | Tickets per active account | Need for assisted support | Complexity, support entitlement, account maturity |
Compare matched customer cohorts and show their sizes, observation windows, and account mix. Keep the two types of retention separate: customer retention tracks product use or renewal, while employee retention tracks workforce tenure.
Report both raw and adjusted cohort differences. Do not count the full renewal amount as community revenue. Count community influence only when a documented interaction helped with adoption, implementation, or problem resolution.
Use this worksheet to choose one primary outcome, one supporting indicator, and one data owner per applicable area. Preserve the baseline at every review. Mark incomplete six- or twelve-month hiring cohorts as pending, not final.
| Area | Primary outcome | Supporting indicator | Baseline and comparison | Data owner | Review and uncertainty |
|---|---|---|---|---|---|
| Support | Tickets per active account | Validated deflected interactions | Prior quarter and matched accounts | Support Operations | Quarterly; document validation gaps and low/base/high cost assumptions |
| Hiring | Twelve-month retention of community-sourced hires | Qualified applicants per open role | Similar roles and hiring periods | Recruiting Operations, People Analytics, and Community | Quarterly updates; separate sourced from influenced candidates |
| Customer retention | Renewal rate | Feature adoption rate | Comparable engaged and non-engaged accounts | Product Analytics and Customer Success | Quarterly; control for account size, tenure, and prior usage |
3. Measure product feedback and lasting reach
After support, hiring, and retention, measure the two remaining CFO levers: faster product decisions and lasting distribution. Faster feedback cuts rework. Repeatable distribution reduces reliance on paid acquisition.
Track feedback from report to release
Track how community input affects product decisions, release speed, and adoption after release. Connect each report to the decision it informed, the release, and the results that followed. Use feedback velocity as the financial proxy.
The Python Developer’s Guide offers a public example:
A public issue-triage process checks duplicates, labels issues, assigns owners, verifies reproduction, records affected versions, and adds tests when needed.
This helps teams handle reports, but it does not prove ROI.
| Stage | Record and timestamp | Accountable owner | Measure |
|---|---|---|---|
| Collection | Source, date received, acknowledgment, reproduction steps, affected version | Community or support team | Complete-report rate; acknowledgment time |
| Synthesis | Duplicates, affected segments, validation and classification dates | Product operations | Report-to-validation time; duplicate rate |
| Prioritization | Score, decision date, rationale, next action | Product manager and engineering lead | Validation-to-decision time; accepted, deferred, and rejected items |
| Delivery | Engineering start, completion, release date, linked changelog | Engineering lead | Decision-to-release time; shipped changes |
| Validation | Affected cohort, usage, recurring issues, first adoption date | Product analytics | Post-release adoption; workflow completion; release-to-adoption time |
Use a documented 1–5 scale to score reproducibility, affected users, workflow impact, product fit, engineering effort, and adoption potential. Keep effort separate: a higher effort score means more work, not more value. Treat adoption potential as a hypothesis to test, then measure actual adoption after release.
Report these separately:
“community surfaced the issue”
“the change shipped”
“user behavior improved”
A before-and-after change is a signal, not proof.
After the change ships, test whether the same community channel continues to drive qualified repeat visits.
Compare owned relationships and paid reach
Owned reach costs time and tooling; paid reach buys access. Compare operating costs and qualified reach, not audience size. Permission-based relationships allow repeated contact only while developers keep participating.
| Dimension | Owned relationships and channels | Paid reach |
|---|---|---|
| Cost behavior | Recurring content, moderation, tooling, and relationship work | Campaign activity plus ad production and measurement work |
| Measurement | Returning developers, referrals, participation, activation, retention, and cohort behavior | Reach, qualified visits, click-through, conversion, assisted activation, and post-campaign activity |
| Durability | Can persist with permission, trust, and maintenance | Usually declines when the campaign or placement ends |
| Control | More control over follow-up; consent and platform rules still apply | Depends on placement, inventory, and platform rules |
| Scalability | Grows through contributions and referrals; needs capacity to support the work | Can expand quickly within targeting and inventory limits |
| Risk | Dormant members, fatigue, moderation burden, privacy obligations | Weak qualification, message fatigue, attribution gaps, and dependence on paid access |
daily.dev Ads can promote a technical resource or event through in-feed native ads and post-page ads. Define qualified developers before launch. Then track repeat reach, returning developers, referrals, participation, and assisted activation within a fixed window, such as 30 days.
Measure qualified visits after campaigns end. Impressions show exposure - not lasting access or incremental value.
Use this worksheet to choose one feedback bottleneck and one downstream distribution outcome for next quarter. Before approving the test, require one leading metric, one downstream outcome, actual baselines, an owner, a review date, and an uncertainty note. These proposed actions are test designs, not reported results.
Area Question Example answer Feedback bottleneck Where does community input slow down? Reports lack reproduction details, delaying validation Baseline What is the current level? Median report-to-validation time and percentage validated within seven days Intervention What will change? Add a structured report form and assign a weekly triage owner Feedback owner Who is accountable? Product operations manager Distribution outcome What downstream behavior matters? Qualified repeat visits from developers who activate after visiting a community-referred resource Baseline What is the current level? Prior-quarter returning-developer rate and assisted-activation rate Measurement method How will it be attributed? Tagged links, consented account matching, and a defined 30-day window Campaign or program What activity will be tested? A technical resource promoted through in-feed and post-page placements Guardrail What must not deteriorate? Community participation quality, unsubscribe rate, or negative feedback Review decision What happens next? Scale, revise, or stop based on qualified repeat visits and adoption evidence
Treat community feedback and distribution as measurable operating inputs, not automatic returns. Carry the leading metrics, baselines, and uncertainty notes into the quarterly scorecard.
4. Build a quarterly CFO scorecard
Report results and uncertainty
Bring the prior section’s leading metrics into a single quarterly finance review.
Lead with the fully loaded quarterly cost, showing actual spending against the approved budget. Include compensation, contractors, moderation, software, events, content, analytics, engineering, and overhead.
Report three to five business outcomes - not a blended engagement score. Cover support, hiring, retention, feedback, and owned distribution. For each outcome, show the current-quarter result, target, baseline, comparison cohort, source system, attribution method, confidence level, and low/base/high scenarios. If finance hasn’t approved a dollar input, report the metric in operational units.
| Outcome | Primary metric and evidence source | Baseline, comparison, and attribution | Supporting indicators and missing finance input |
|---|---|---|---|
| Support capacity released | Validated deflected cases; community and ticketing records | Prior-quarter comparable cases; matched question types and customer segments; ticket matching or pre/post comparison | Escalation rate and resolution time; finance must approve the marginal cost per comparable case and confirm any actual spending reduction |
| Hiring efficiency | Time to fill; HRIS and recruiting records | Prior-quarter baseline; candidates in the same role families and hiring period; documented source attribution | Qualified applicants and recruiting spending per hire; HR and finance must approve recruiting-cost or vacancy-cost assumptions |
| Retention or expansion influence | Renewal rate among participating accounts; CRM and billing records | Prior-quarter baseline; accounts matched on plan, tenure, usage, and renewal date; matched-cohort comparison | Expansion, adoption, and churn; finance must supply contribution margin before converting results to dollars |
| Product-feedback cycle time | Median days from report to release; product-management records | Prior-quarter baseline; comparable issue types and severity; pre/post or matched comparison | Report-to-decision time, accepted reports, and post-release usage; Engineering or Product Finance must approve any avoided-rework estimate |
| Owned-distribution efficiency | Repeat visits from qualified developers; analytics and program costs | Prior-quarter baseline; common action definition across channels; comparison with paid reach through tagged referrals or a holdout | Cost per qualified interaction, reachable members, qualified subscribers, referrals, and product-qualified actions; finance must provide the relevant paid-media or acquisition-cost input before assigning a dollar value |
Complete every row with its definition, current result, target, baseline, cohort size, source query, cutoff date, owner, attribution method, confidence, assumptions, interpretation, and next action. Flag changes to definitions or systems, along with relevant product launches, pricing changes, and staffing changes.
Use high confidence for controlled evidence, medium when confounding factors are known, and low for descriptive or incomplete evidence. A high scenario does not turn influenced revenue into a proven return.
Avoid double counting and plan the next test
Keep cash savings, capacity value, influenced revenue, and nonfinancial indicators separate. Fewer agent hours mean released capacity - not verified cash savings unless spending falls. Give each monetary return its own ID and reconcile it to the budget or financial record. Disclose missing identity matches, incomplete ticket tags, selection bias, and launch or staffing changes.
Calculate financial ROI ONLY as (verified savings + approved incremental contribution margin − fully loaded program cost) ÷ fully loaded program cost. Don’t count those same returns again as retained revenue, capacity value, or media-equivalent value.
For the next-quarter test, propose structured peer answers for the top ten recurring technical questions. Compare a pilot segment with a matched non-pilot segment or use a staggered rollout. Measure eligible support demand, escalations, resolution time, and satisfaction. Community Operations owns the test; Support Operations and Finance Analytics validate results. Before launch, record the requested budget, cost categories, test duration, decision date, and agreed thresholds.
Using that scorecard, Finance should approve a limited pilot, renew, increase, hold, reduce, or stop funding based on the agreed thresholds, evidence quality, measurement gaps, and test cost - not membership growth alone.
5. Conclusion: justify funding with evidence
Use the quarterly scorecard to make the funding case. Base your request on CFO outcomes, not community size. Work from agreed baselines and fully loaded program costs. Label attribution confidence as high, medium, or low. Keep observed results, estimates, and scenarios separate - and present them in that order.
Keep the request bounded: fund the next quarter, assign one owner, set one review date, and define one stop-or-scale rule. Use finance-approved inputs for dollar claims, and say only what the evidence supports.
Make the funding call with the scorecard, then record the next test in one worksheet.
| Field | What to record |
|---|---|
| Strongest current evidence | Outcome, period, sample size, baseline, current result, source, confidence, and evidence type. |
| Largest uncertainty | The main gap and how it affects the funding call. |
| Next measurement action | Test or data fix, owner, deadline, success criterion, and decision. |
FAQs
How do I justify community funding before ROI is proven?
Position community as a business asset that cuts costs and helps growth. Give CFOs proxy metrics they can track: peer-to-peer support, community-sourced candidates, retention and churn by cohort, feature adoption, time to first value, and owned distribution.
Keep leading indicators, such as documentation visits, separate from lagging indicators, such as qualified signups and pipeline value. Connect community activity to revenue outcomes using conservative estimates and self-reported attribution, without overstating its impact.
How can I measure ROI with limited community data?
Move beyond volume-based metrics. Use behavioral proxies and qualitative feedback to understand how people find your product and use it. Add a “How did you hear about us?” survey during onboarding to track discovery through dark social - sharing that standard analytics may miss.
Track intent signals such as how deeply users read your documentation, whether they generate an API key, and their Time to First Value (TTFV).
Use cohort analysis to compare users who engage with your community against those who don’t. Look for higher Net Dollar Retention, faster feature adoption, and fewer support tickets among community-engaged users.
Which community outcome should I measure first?
Start with an outcome that supports your company’s goals. Track activation rates to measure product adoption, retention to measure whether people stay, or support ticket deflection to measure progress toward lower support costs.
Focus on what members do, not just how many join. Behavioral indicators, such as time-to-first-contribution and peer-to-peer support ratios, tell you more than total member count.
Connecting these measures to business goals helps position community work as a driver of growth, rather than an optional expense.