

Most developer ads are undercounted. If I want to know whether a campaign caused more trials, pipeline, or revenue, I can’t rely on last-click alone. I need an incrementality test that compares an exposed group with a holdout group and measures the gap.
Here’s the short version:
- Attribution shows credit. It tells me which tracked touchpoint got the conversion.
- Incrementality shows lift. It tells me what happened because of the ads.
- Developer journeys often run through Slack, Discord, docs, branded search, and cross-device research, so many touches never appear in analytics.
- A clean test needs:
- similar groups before launch
- a true holdout
- one preset KPI
- a stable test window
- The two main setups are:
- audience holdouts when I can suppress users or accounts
- geo-splits when I can only control exposure by market
- For small audiences, I should use longer windows and pick outcomes like qualified trials, activated accounts, or pipeline, not just raw sign-ups.
- I should report lift plus the confidence interval, not just one headline number.
A simple example: if the treatment group converts at 3.00% and the holdout converts at 2.40%, the campaign drove 25% relative lift. That is the part attribution often misses.
| Measure | What it tells me | Main issue |
|---|---|---|
| Platform reporting | What the ad platform logged | Doesn’t show causation |
| Last-click attribution | Which tracked touchpoint got credit | Misses untracked influence |
| Incrementality testing | What the ads added | Needs a controlled test and enough data |
If I want to prove ad impact in developer marketing, the goal is simple: test for lift, not just credit.
How incrementality testing works
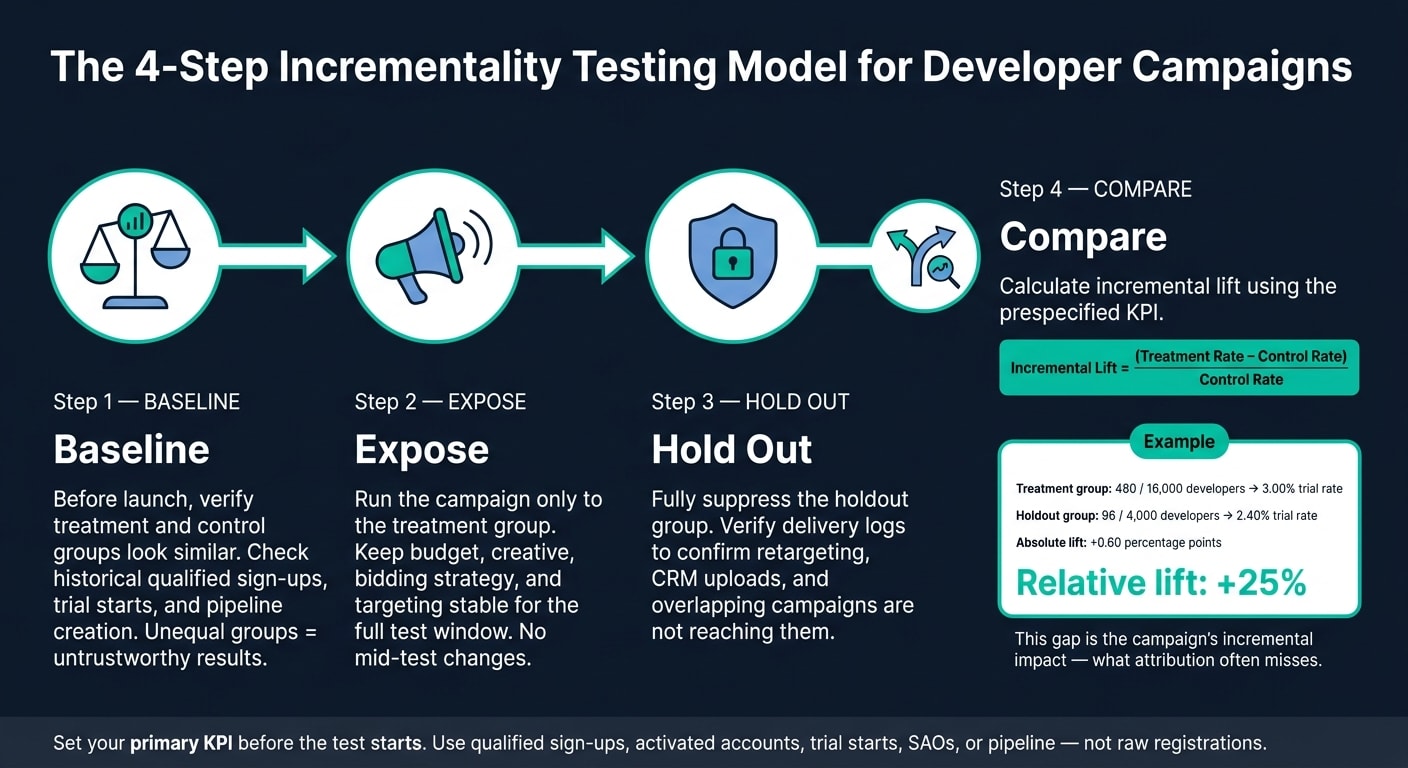
Incrementality testing is simpler than the name makes it sound. You run a campaign for one group, hold it back from a similar group, and then measure the gap.
The group that sees the ads is the treatment group. The group that doesn't is the holdout or control group. Both groups should run during the same time window so seasonality, product launches, and other outside factors hit them at the same time.
That matters a lot in developer marketing. A developer might do quiet research, share links in private chats, or come back later through a branded search. Because of that, the difference between treatment and holdout is often a better estimate of what the campaign actually caused.
The 4-step model: baseline, expose, hold out, compare
Once attribution stops giving you a clean answer, the next step is to measure causal lift as directly as you can.
Baseline: Before launch, make sure treatment and control look similar. Check historical qualified sign-ups, trial starts, and pipeline creation. Use audience makeup as a balance check too. If the groups look meaningfully different before the test begins, the result is much harder to trust.
Expose: Run the campaign only to the treatment group. Keep budget, creative, bidding strategy, and targeting steady for the full test. Don't swap the offer or change the landing page in the middle.
Hold out: Suppress the holdout group completely. Check delivery logs to confirm that retargeting, CRM uploads, and overlapping campaigns aren't reaching them.
Compare: Compare outcome rates, then calculate lift. The basic formula is Incremental lift = (Treatment outcome rate − Control outcome rate) / Control outcome rate. Use the KPI you picked before the test started, not the metric that happens to look best after the fact.
Here’s a simple example. If 480 out of 16,000 treatment developers start a trial, that's 3.00%. If 96 out of 4,000 holdout developers start a trial, that's 2.40%. The absolute lift is 0.60 percentage points, and the relative lift is 25%. That gap is your estimate of the campaign's incremental impact.
The primary outcome should be set before the test begins. For a U.S. B2B developer campaign, that usually means qualified sign-ups, activated accounts, trial starts, sales-accepted opportunities, or pipeline dollars. Raw registrations can make impact look bigger than it is if those developers never activate.
What makes a test result trustworthy
The biggest risks are control leakage and changing conditions during the test. If people in the control group still see the campaign through another platform, a second device, or an overlapping audience, the control group's outcome rate goes up. When that happens, measured lift gets smaller, and a campaign that worked can look weaker than it was.
Beyond clean exposure control, consistency matters more than fancy setup. Keep pricing, product availability, sales coverage, and conversion definitions fixed for the full test window. If something major shifts, like a pricing change, a big product release, or a competitor announcement, document it right away. That context matters when you read the results later.
| Condition | Why it matters |
|---|---|
| Comparable groups at baseline | Removes pre-existing differences as an explanation for the outcome gap |
| Holdout fully withheld | Prevents control lift from masking true campaign impact |
| Primary KPI prespecified | Stops the team from picking whichever metric looks best after the fact |
| Stable test protocol | Ensures the only planned difference between groups is ad exposure |
| Major events documented | Allows reviewers to assess whether external factors distorted results |
Which test design to use depends on whether you can suppress users directly or need to split by market.
Picking the right test design for developer audiences
Once you know the KPI, pick the test design that gives you the best control over exposure. That sounds simple. In practice, it usually isn't.
Developer journeys often run through dark social, cross-device research, and private community channels. So even if a test looks clean on paper, exposure can leak in from all over the place. And that one choice - which test design you use - has a big impact on whether the result holds up.
Audience holdouts when user-level suppression is possible
Use an audience holdout when you can suppress exposure at the account or user level. For developer campaigns, randomize at the account or organization level.
Here's why: if one engineer is in the holdout group but a teammate at the same company still sees the ads, your control group is already compromised. The account has still been exposed. So lock eligibility and group assignment before launch.
A developer who is held out from one campaign can still run into the same message somewhere else - through another channel, a coworker's account, or organic content. When that happens, the holdout group's outcome rate goes up, and measured lift gets smaller.
Use this design when one account or user can be assigned cleanly and fully suppressed.
Geo-splits and matched-market tests when holdouts are not feasible
When user-level suppression isn't reliable - because the audience is anonymous, spread across platforms, or too small to randomize cleanly - a geo-split is usually the better option.
In that setup, you run the campaign in selected U.S. states or DMAs and pause the channel in matched control markets. Then you measure outcomes at the market level, such as:
- Qualified leads
- Pipeline
- Product signups
- Revenue
The hard part is market selection. That's what decides whether a geo test is believable or not.
Use 10–16 weeks of historical data to match markets with similar conversion trends, developer mix, and seasonality. Weekly revenue or conversion correlations above 0.80 make for stronger matches. If no single market is close enough, use a synthetic control instead. That means building a weighted mix of several untreated markets and calibrating it to match the treated market's pre-test behavior.
One more thing: don't just cut spend in control markets. Pause it completely. And plan for a 60–90 day window, because opportunities, pipeline, and revenue often lag exposure by weeks.
Use this when exposure can only be controlled by market, not by user.
Audience holdouts vs. geo-splits: a side-by-side comparison
Neither design is immune to contamination. Engineers travel, work remotely, use VPNs, and often share corporate accounts across regions. That's why it helps to know how each method tends to break.
| Dimension | Audience holdout | Geo-split or matched market |
|---|---|---|
| Control method | Suppress eligible accounts from the campaign | Pause the channel in matched control markets |
| Best fit | Addressable platforms, CRM audiences, logged-in users, and account lists | Channels without reliable user-level suppression |
| Main strength | Cleaner randomization and tighter exposure control | Captures cross-device spillover |
| Implementation effort | Requires identity resolution and suppression | Requires market selection, activation, and time-series analysis |
| Primary limitation | Leakage through other accounts, platforms, or campaigns | Imperfect market matching and geographic spillover |
| Why developer tests are messy | Multiple engineers influence one account; individual assignment fails | Remote work, travel, and VPNs blur regions |
Audience holdouts usually offer stronger experimental control when you can enforce them cleanly. Geo-splits are often the more practical choice when the audience is small, fragmented, anonymous, or spread across channels.
Either way, the result only means much if the test is set up and run well. That comes down to clean randomization or matching, stable execution, enough measurement volume, and clear reporting on contamination.
After the design is set, the next question is which outcomes can still show lift when direct conversions are sparse.
What to measure when direct conversions miss the full picture
When direct conversions are thin, look at business outcomes and supporting signals side by side.
Direct sign-ups almost never show the whole story in developer campaigns. A developer might see an ad, mention it in Slack, search for the brand later, and then sign up on a different device. In that path, last-click often gives credit to organic search or direct traffic instead. So the test should focus on lift in business outcomes, not just attributed sign-ups.
Primary outcomes: qualified conversions, pipeline, and revenue
Start with the outcomes that matter most: qualified sign-ups, activated accounts, product-qualified leads (PQLs), sales-qualified leads (SQLs), pipeline created, and revenue when there’s enough volume to read it with confidence.
Define activation before the test starts. For example, that could mean an account that creates a project and makes at least one successful API call within 30 days.
In reporting, keep two columns:
- platform-attributed results
- experiment-estimated incremental results
If the exposed group drives 120 attributed sign-ups, but the control-based estimate shows 30 would have happened anyway, report 90 incremental sign-ups, not 120.
Supporting signals: branded search, direct traffic, and developer actions
Branded-search lift is a useful read on demand. If ad-exposed markets go up 12% and control markets go up 3%, that 9-point gap points to higher awareness, not revenue.
You should also track developer actions like direct traffic, documentation visits, SDK or CLI downloads, API-key creation, and repository activity. These signals help explain what changed. But only the difference between treatment and control can support an incremental claim.
A measurement hierarchy: strong evidence vs. weak signals
The table below shows what each metric layer can support - and where it falls short. The big rule is simple: do not add weak signals together to manufacture a causation claim.
| Measurement layer | Examples | What it can support | Main limitation |
|---|---|---|---|
| Primary business outcomes | Activated accounts, PQLs, SQLs, pipeline, revenue | Whether the campaign created measurable incremental business value | Low volume may need longer windows and wider uncertainty ranges |
| Supporting behavioral signals | Branded search lift, direct traffic, organic branded visits, docs visits, SDK downloads, repository activity | Whether awareness, consideration, and developer engagement changed relative to a baseline | Correlation alone cannot prove ads caused the change |
| Attributed conversions | Platform-reported sign-ups, click-based conversions | Channel reporting and operational optimization | Can over-credit exposed users; misses untracked dark-social journeys |
| Diagnostic metrics | Impressions, reach, clicks, CTR, CPC, frequency | Delivery quality and troubleshooting | Do not establish incremental business impact |
This hierarchy doesn’t throw out weaker signals. It gives them the right job. Incrementality can still hold up even when attribution is messy, because it rests on layers of evidence instead of one fragile metric. And when volume is low, keep the same hierarchy - just read lift over a longer window.
Running a useful test with small developer audiences
Sample size limits, longer windows, and broader outcomes
Developer audiences are often small, and dark-social-heavy journeys make measurement messier. So the main issue isn't whether to test. It's whether you have enough sample to learn anything useful.
If you want to detect a 10% relative lift at 95% confidence, you may need about 1,600 conversions per variant. A 20% lift may need about 400. That's why you should set the minimum effect worth detecting before the test starts, not after. In plain English: decide what level of change would actually affect a budget call.
When closed deals don't happen often enough to measure in a clean way, switch from rare outcomes to faster ones that still tie back to revenue. For example, use qualified trial starts or pipeline created as the main KPI. That helps you keep a useful signal even when last-click reporting misses much of the path.
Use the pre-period for one job only: check whether the groups moved in similar ways before the test. And don't set the test window by an arbitrary calendar rule. Set it by KPI lag.
How to report results so readers can trust them
With a small test, trust comes from clear reporting. Think of it like a decision memo, not a screenshot from a dashboard.
Include:
- the hypothesis
- the test design
- the dates
- the KPI
- the measured lift
- the confidence interval
- exclusions
- limitations
In small-audience tests, the interval often matters more than the point estimate. An estimated lift of +8% with a 95% interval of −2% to +18% can still mean a small negative effect, no effect, or a meaningful positive effect. That's the tricky part. The headline number may look good, but the range tells you how much uncertainty is still on the table.
If the interval includes zero, call the result inconclusive. Saying it's a win would stretch the data beyond what it supports.
Conclusion: treat incrementality as a repeating measurement practice
Incrementality is best treated as a repeating measurement practice. Run the same test under similar conditions, then use what you learn to tighten the next round. Attribution reports activity; incrementality proves lift.
FAQs
When should I use a holdout versus a geo-split?
Use a holdout when you want to measure overall incremental lift by comparing people who saw the ads with a similar group that saw none. It works well for testing end-to-end impact across long developer journeys, especially when several touchpoints are involved and it’s easy to give credit to the wrong channel.
Use a geo-split when you want to keep the test tied to certain places, like developer hubs or regions, and compare results between areas with different levels of ad exposure.
How long should an incrementality test run?
Typically, at least two weeks and up to six to eight weeks.
The right test length depends on a few things: your traffic volume, the effect size you want to detect, and the fact that developer buying journeys tend to be longer and less linear.
Before launch, set the sample size you need and commit to the planned timeline. Also, make sure the test runs through full business cycles and doesn’t overlap with holidays or other outside factors that could skew behavior.
What KPI should I use if conversions are low?
When conversions are low, start earlier in the journey. Look at intent signals and product-use signals before someone becomes a customer.
That means tracking Cost per Trial (CPT), Trial to Paid Rate, and engagement metrics such as landing page time, documentation views, and API key registrations.
It also helps to watch Brand Search Lift. Why? Because not every buying touchpoint shows up in standard attribution.
Post-signup surveys can fill in some of those gaps and surface dark-funnel influence that normal tracking often misses.